Legendary Charts $SMH semiconductor mappings

$SMH
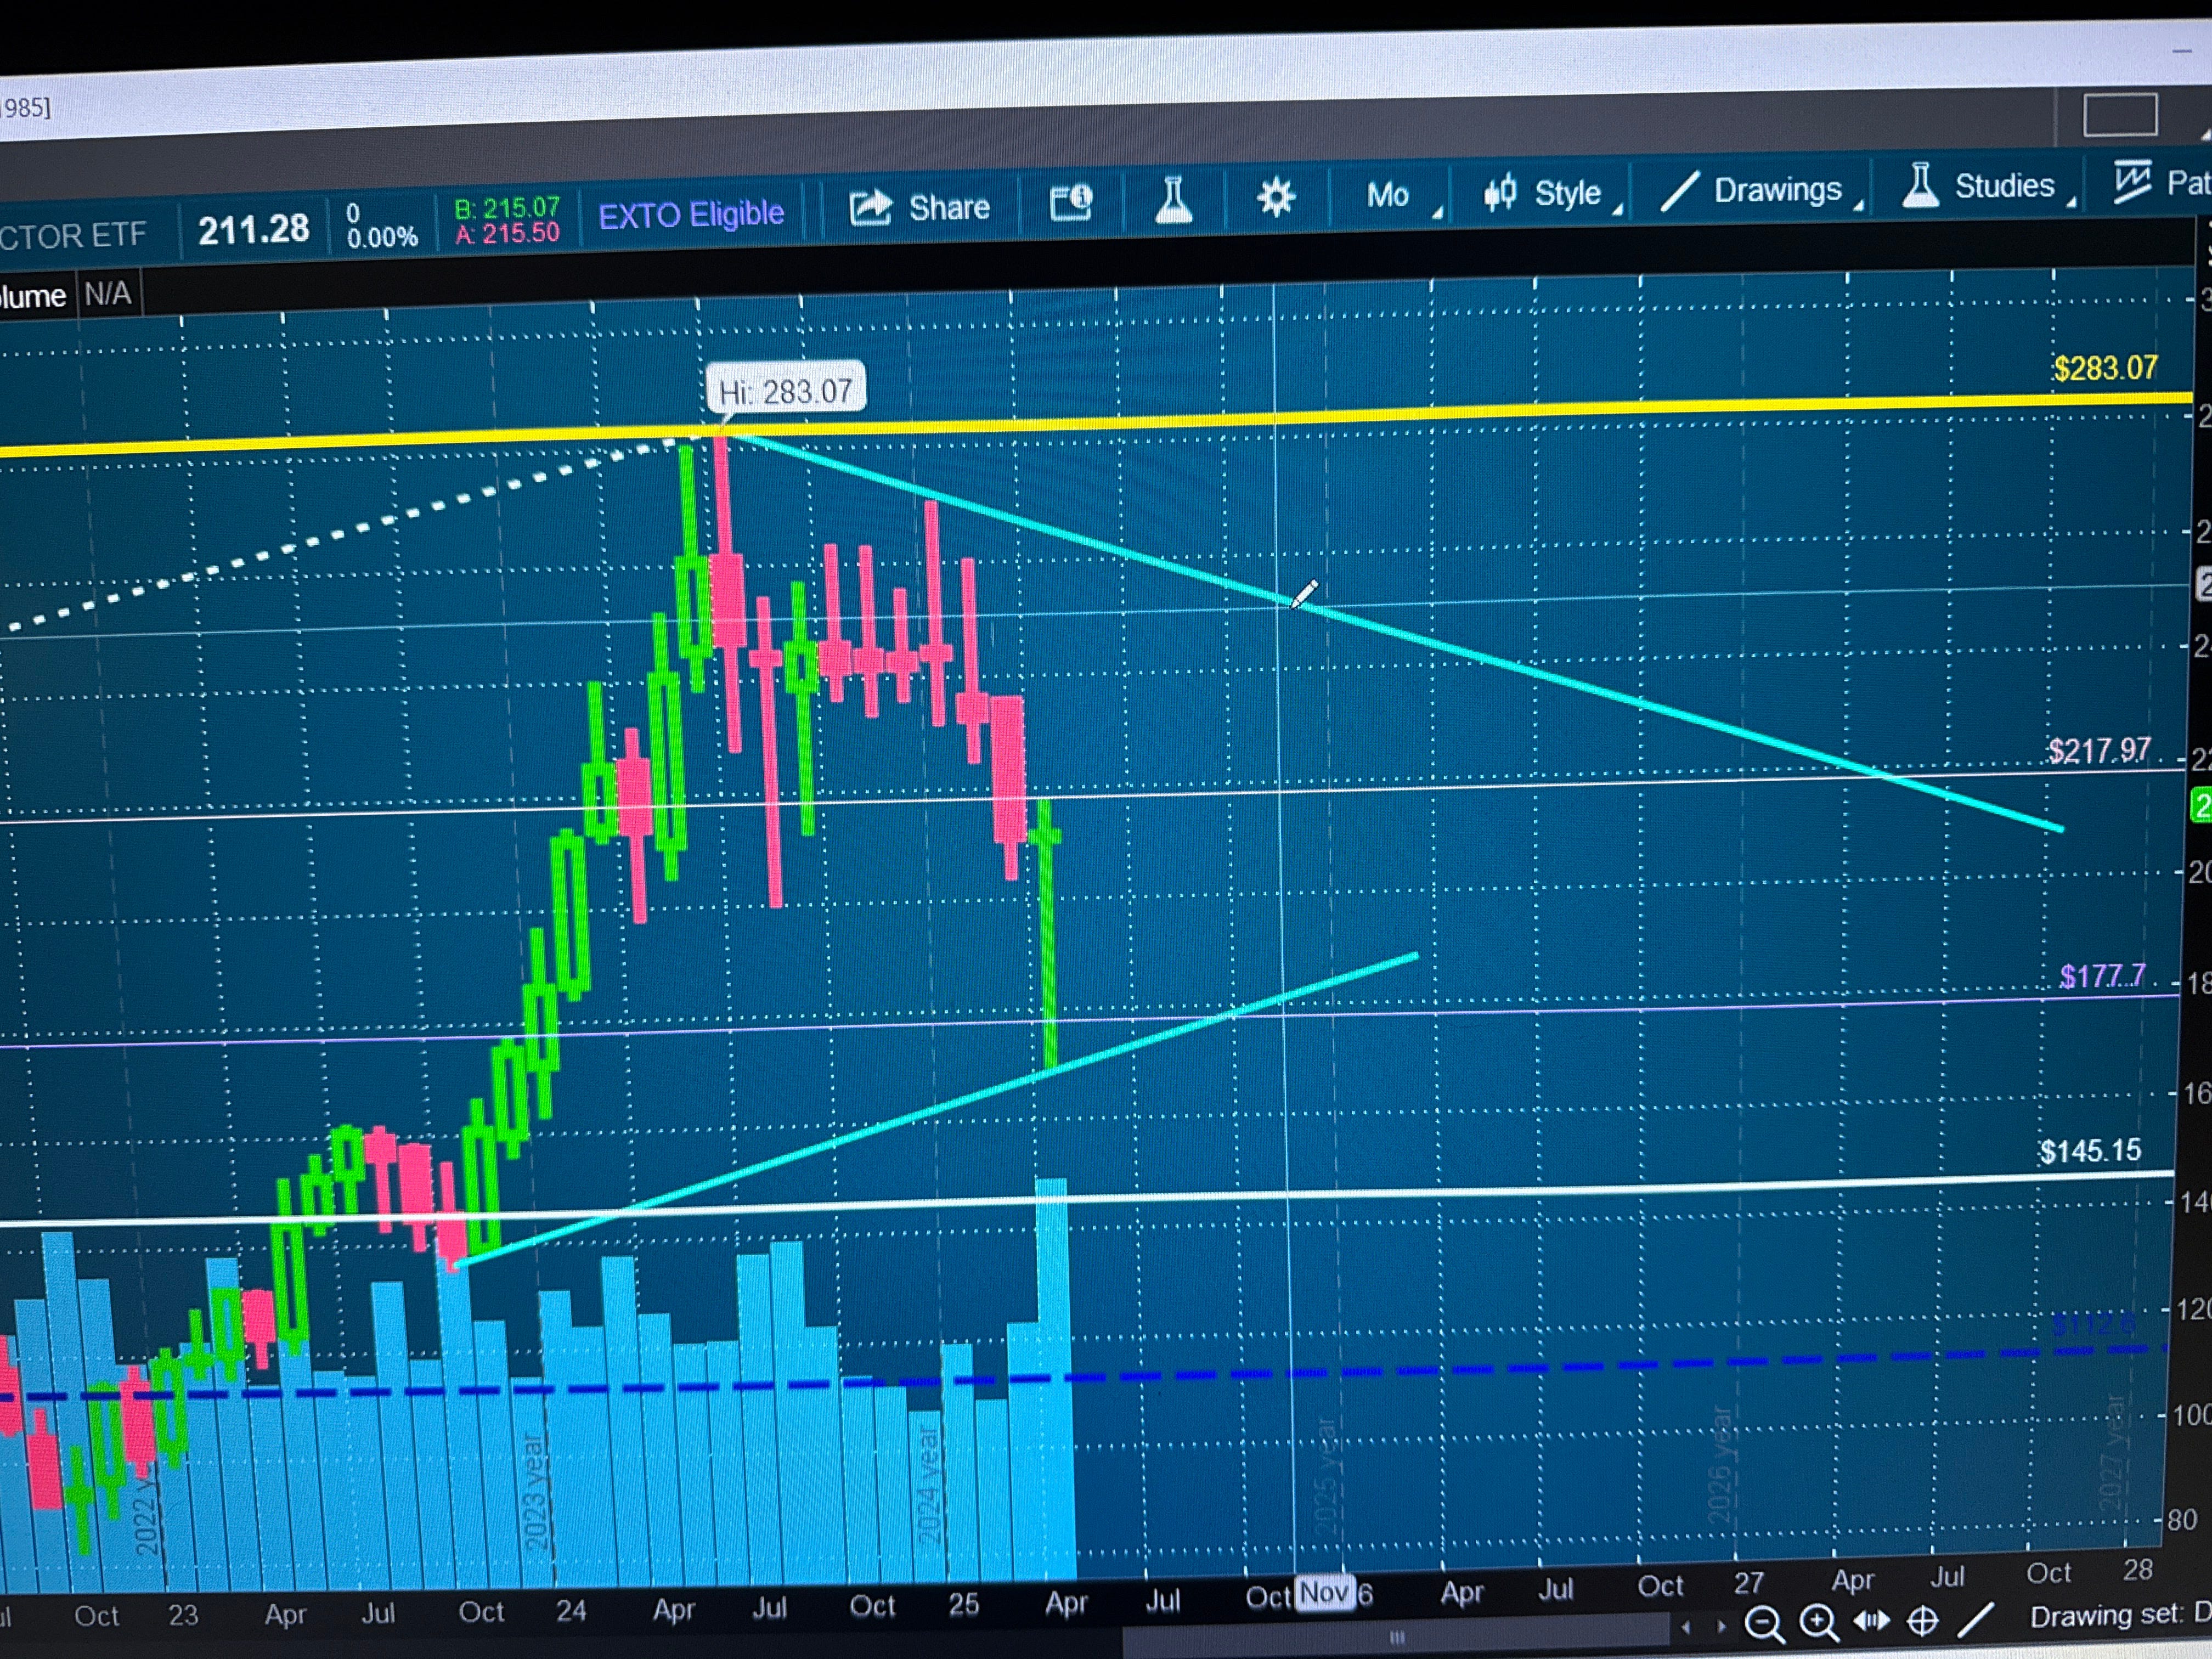
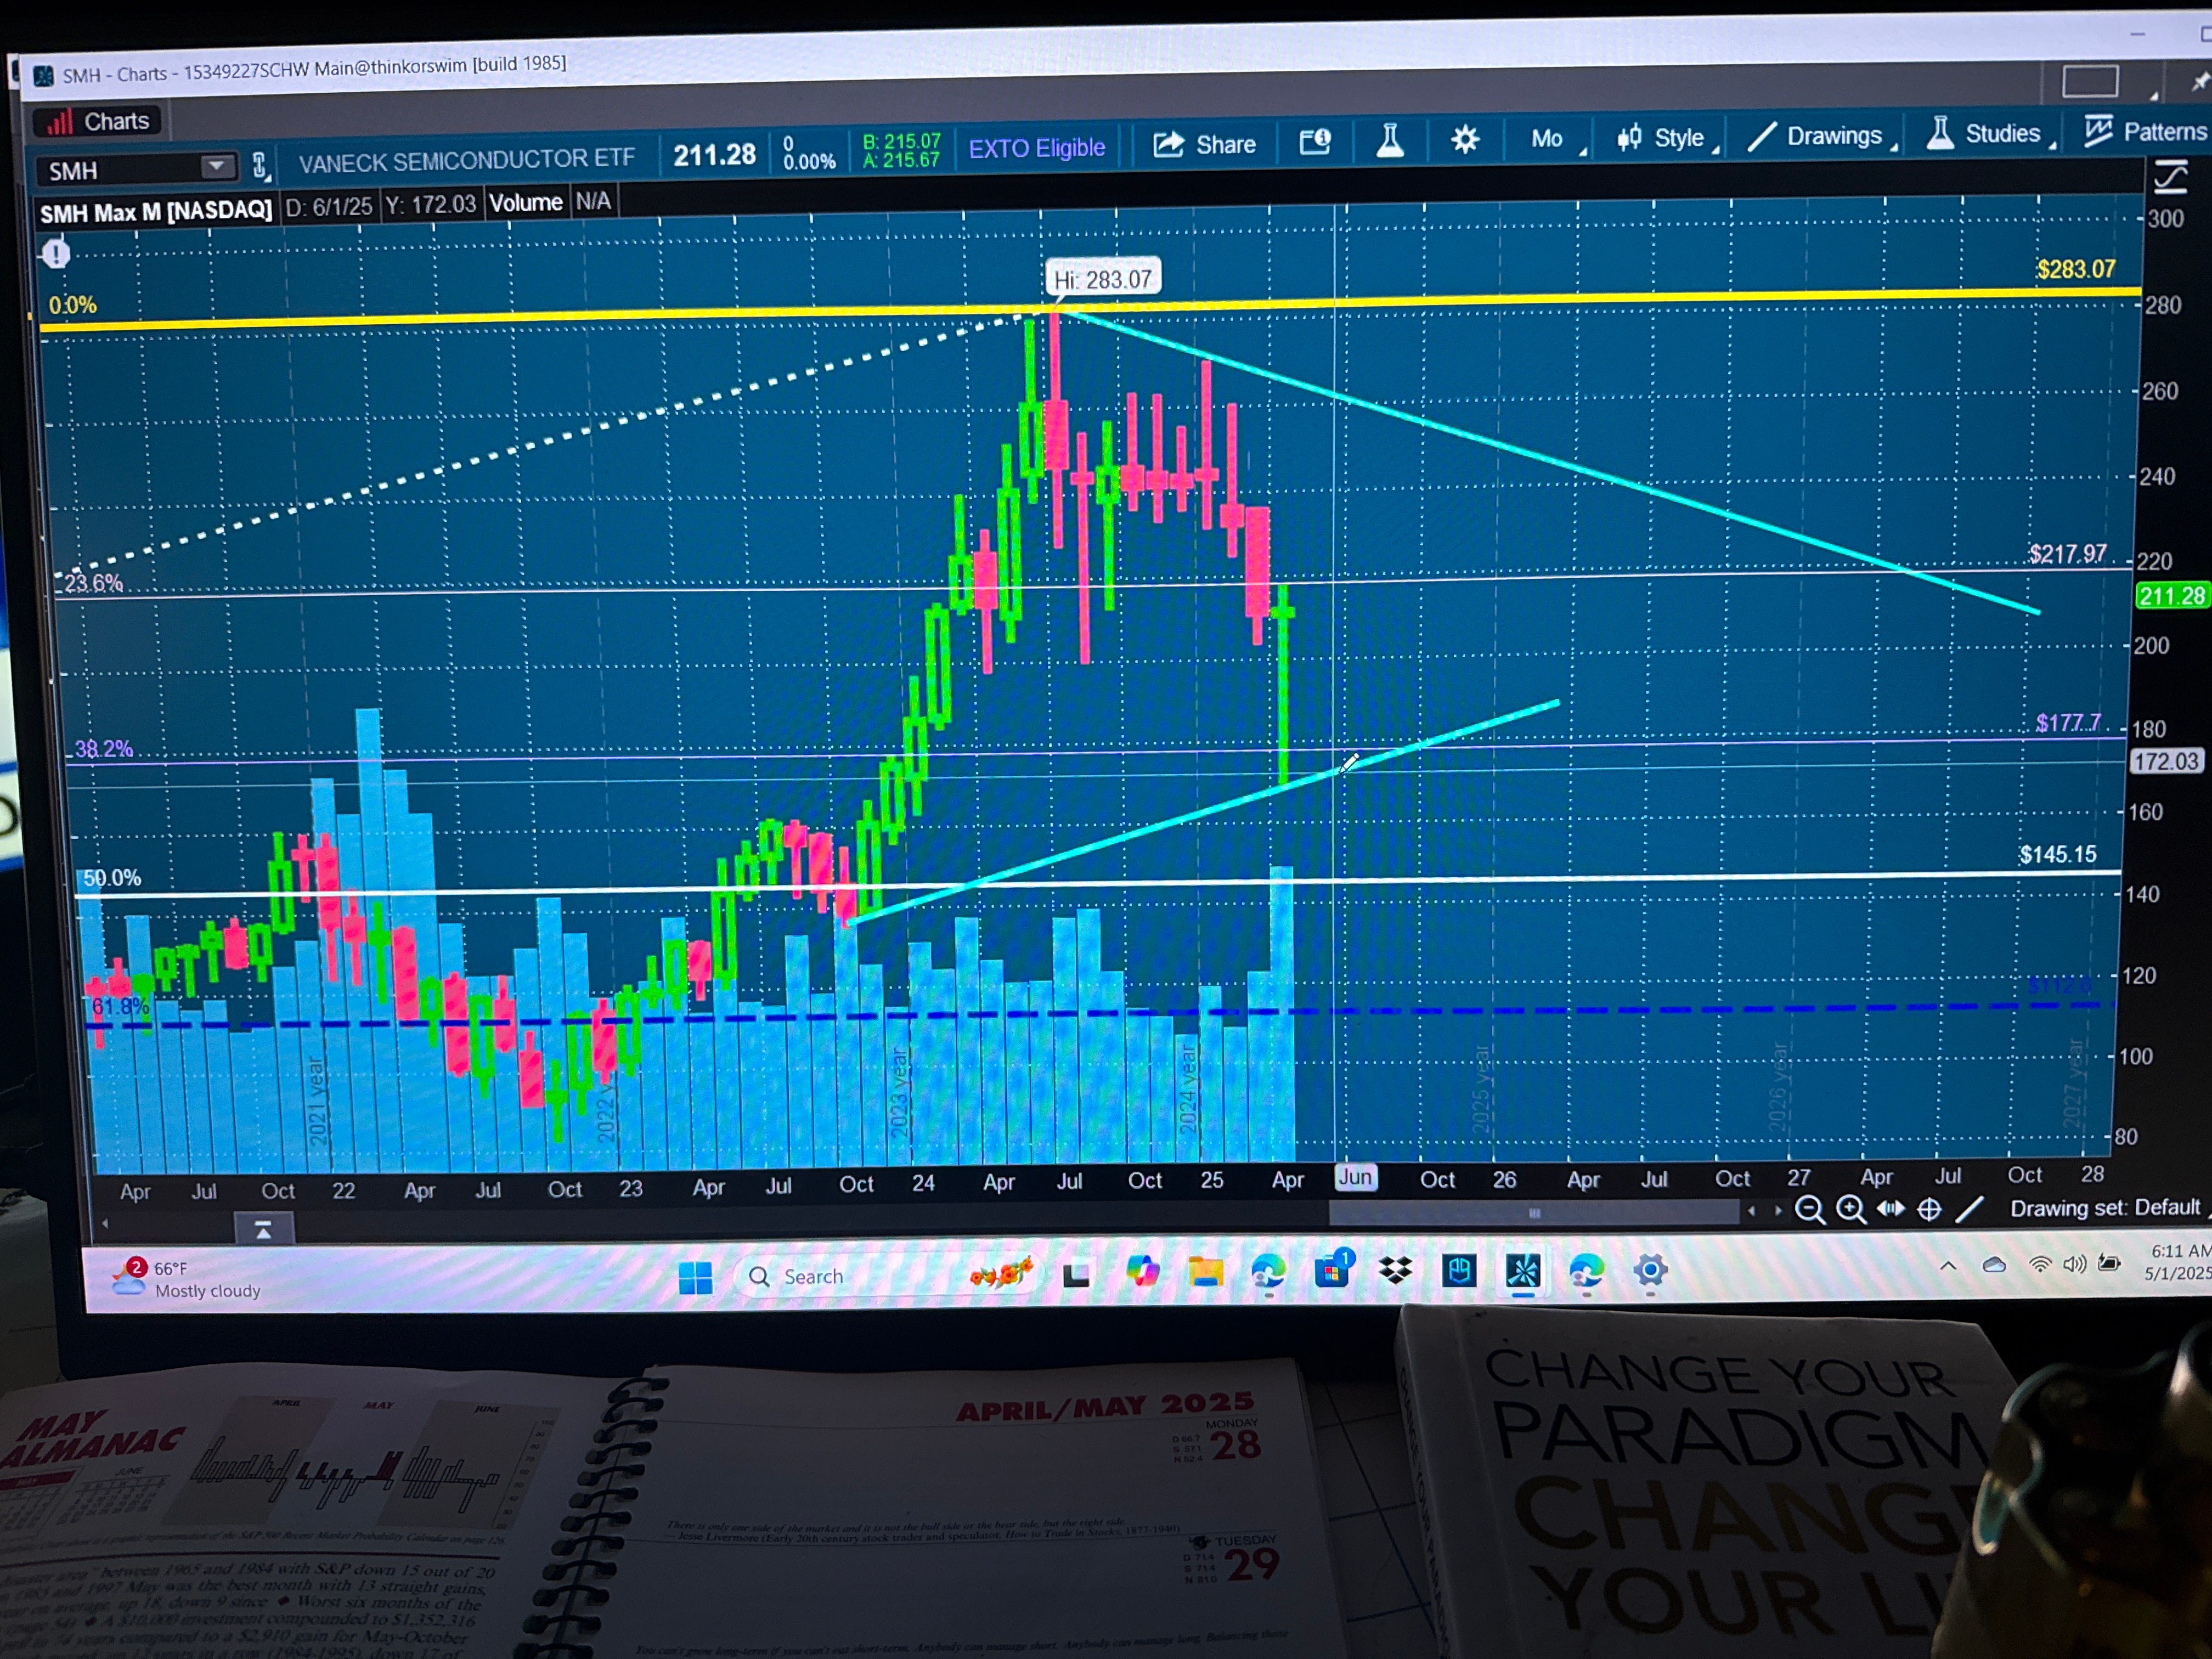
Monthly
Checking in has a trend line from October 2024 gets touch with a lowtail $170.11 with 38.2% $177.70
Currently $215
23.6% 217.97 with monthly candle high is $216.61 has $220 round numbers resistance areas
Volume came in greater than upside a big cross indecision doji candle with uncertainty with this new tariffs trade wars in the systems now.
Throwback resistance comes in around $254.86 target 🎯
Support trend line rising gets $172 rising low
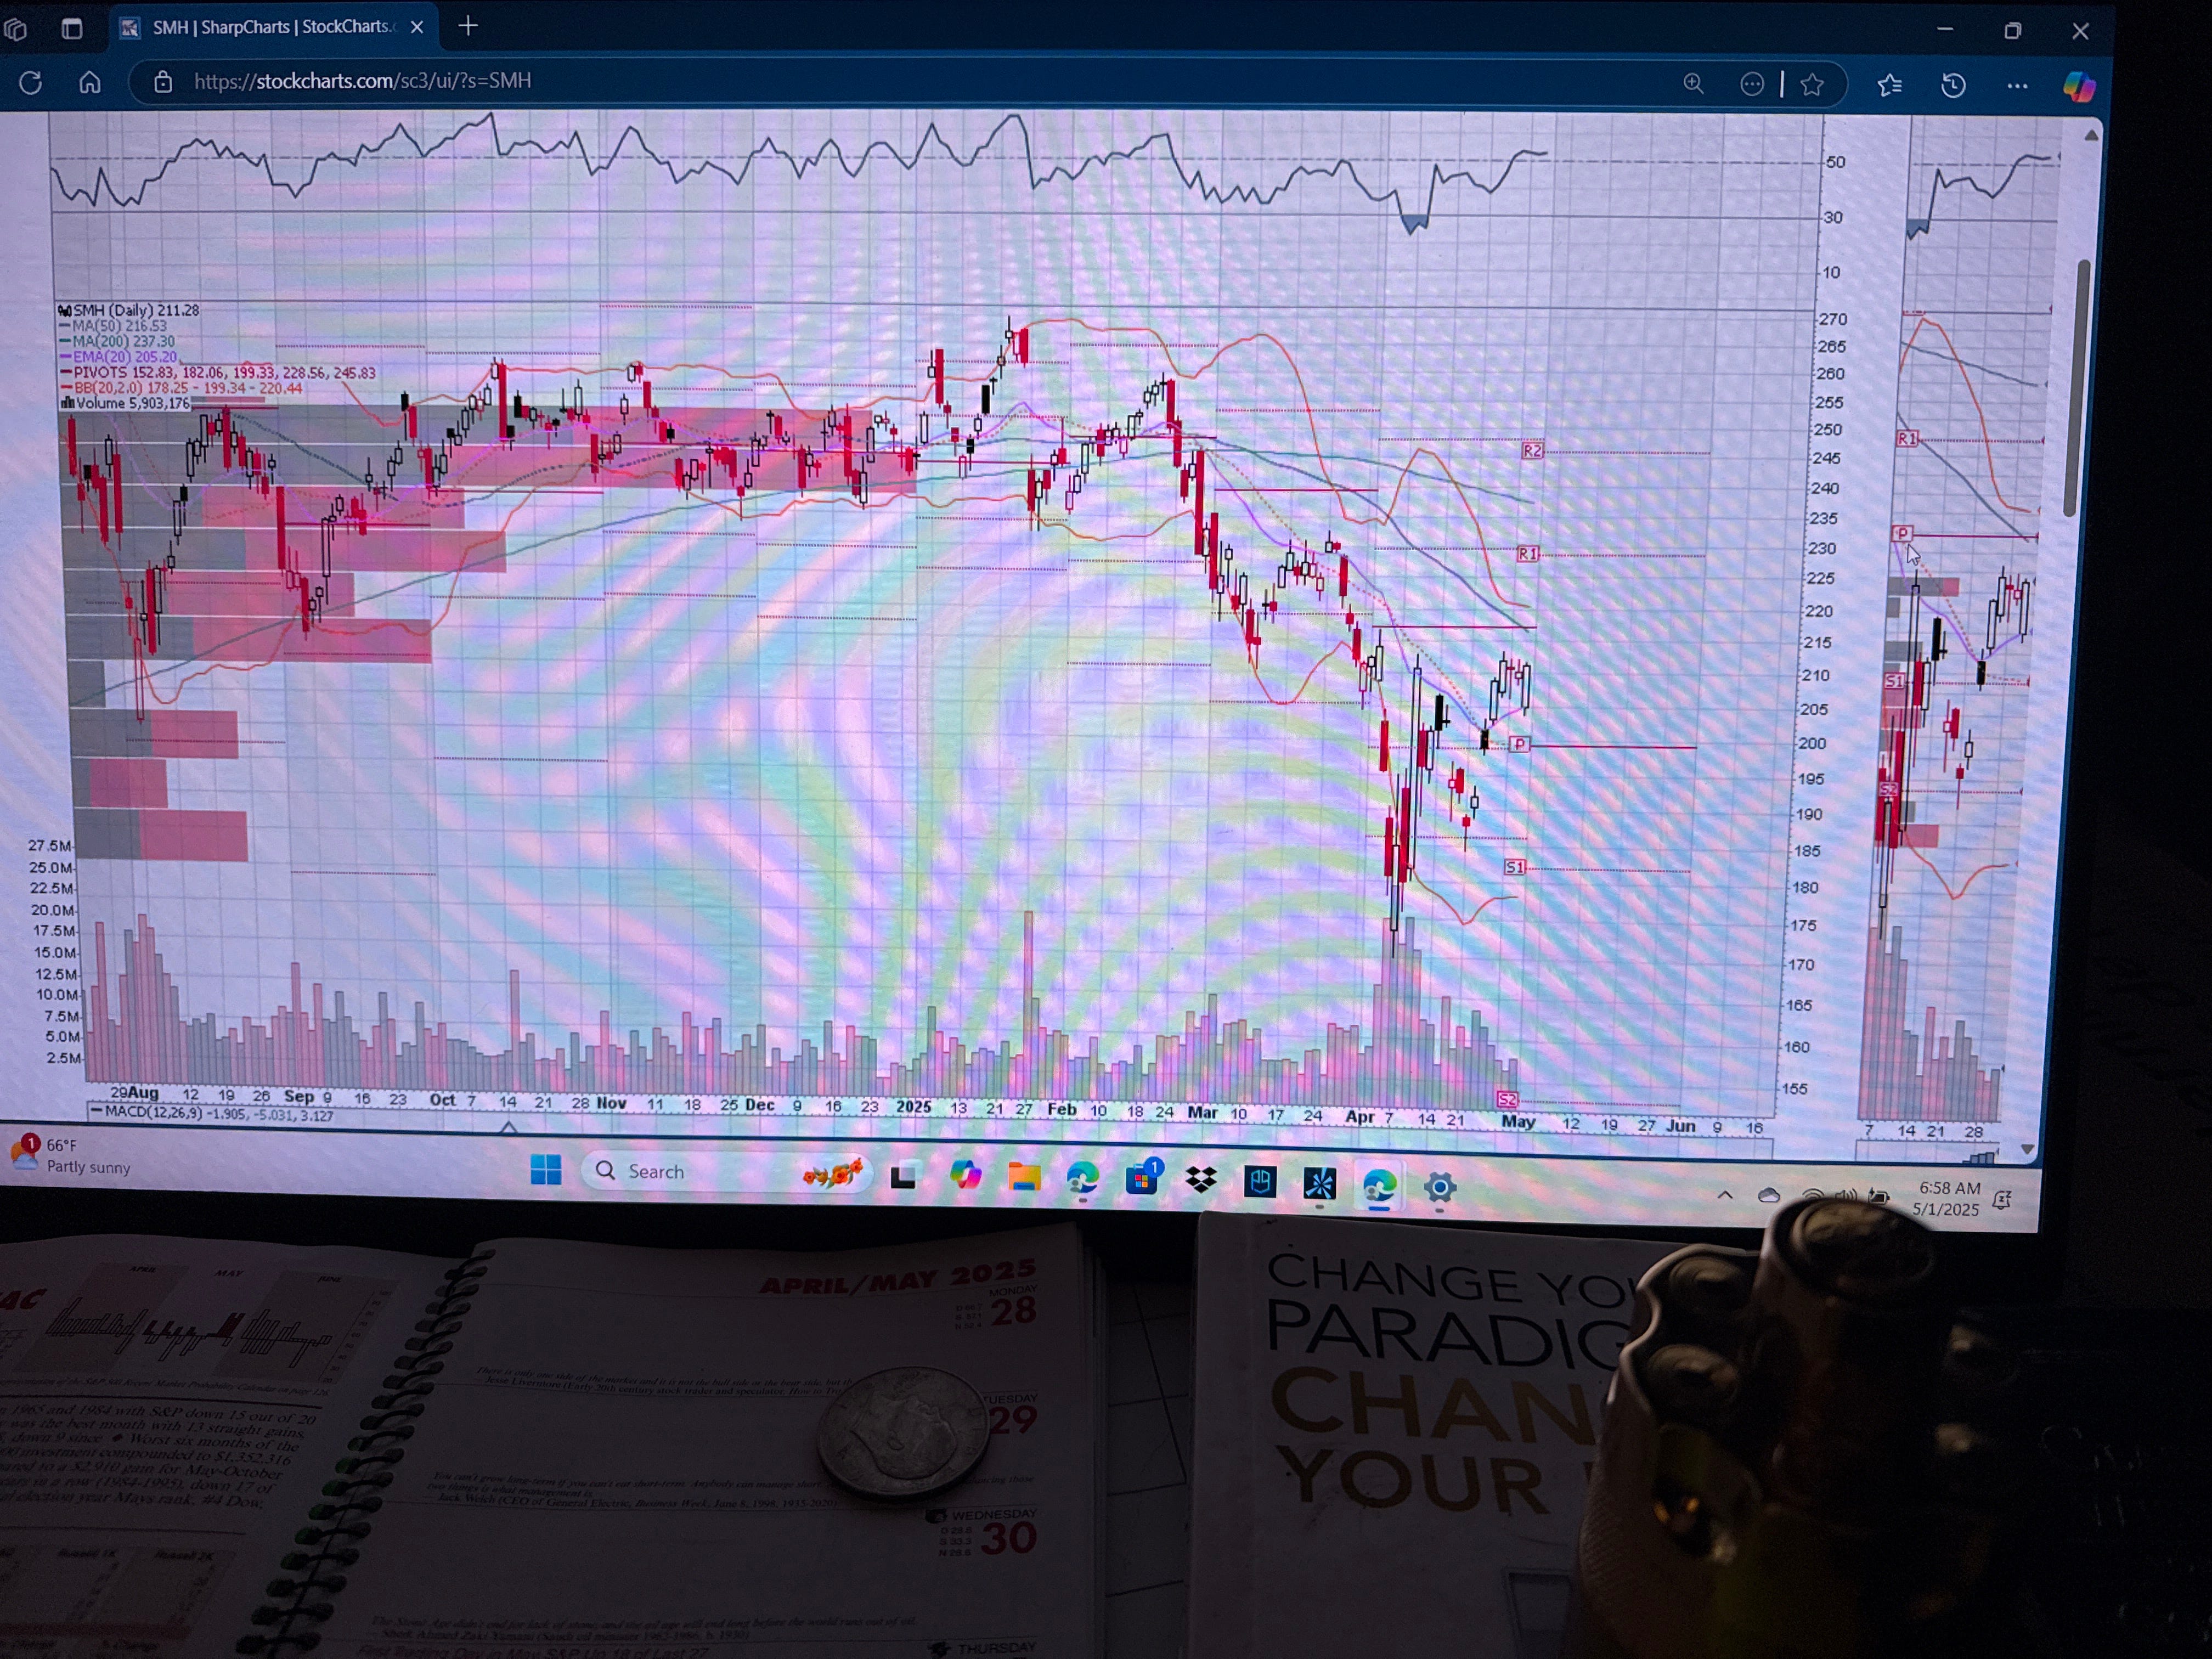
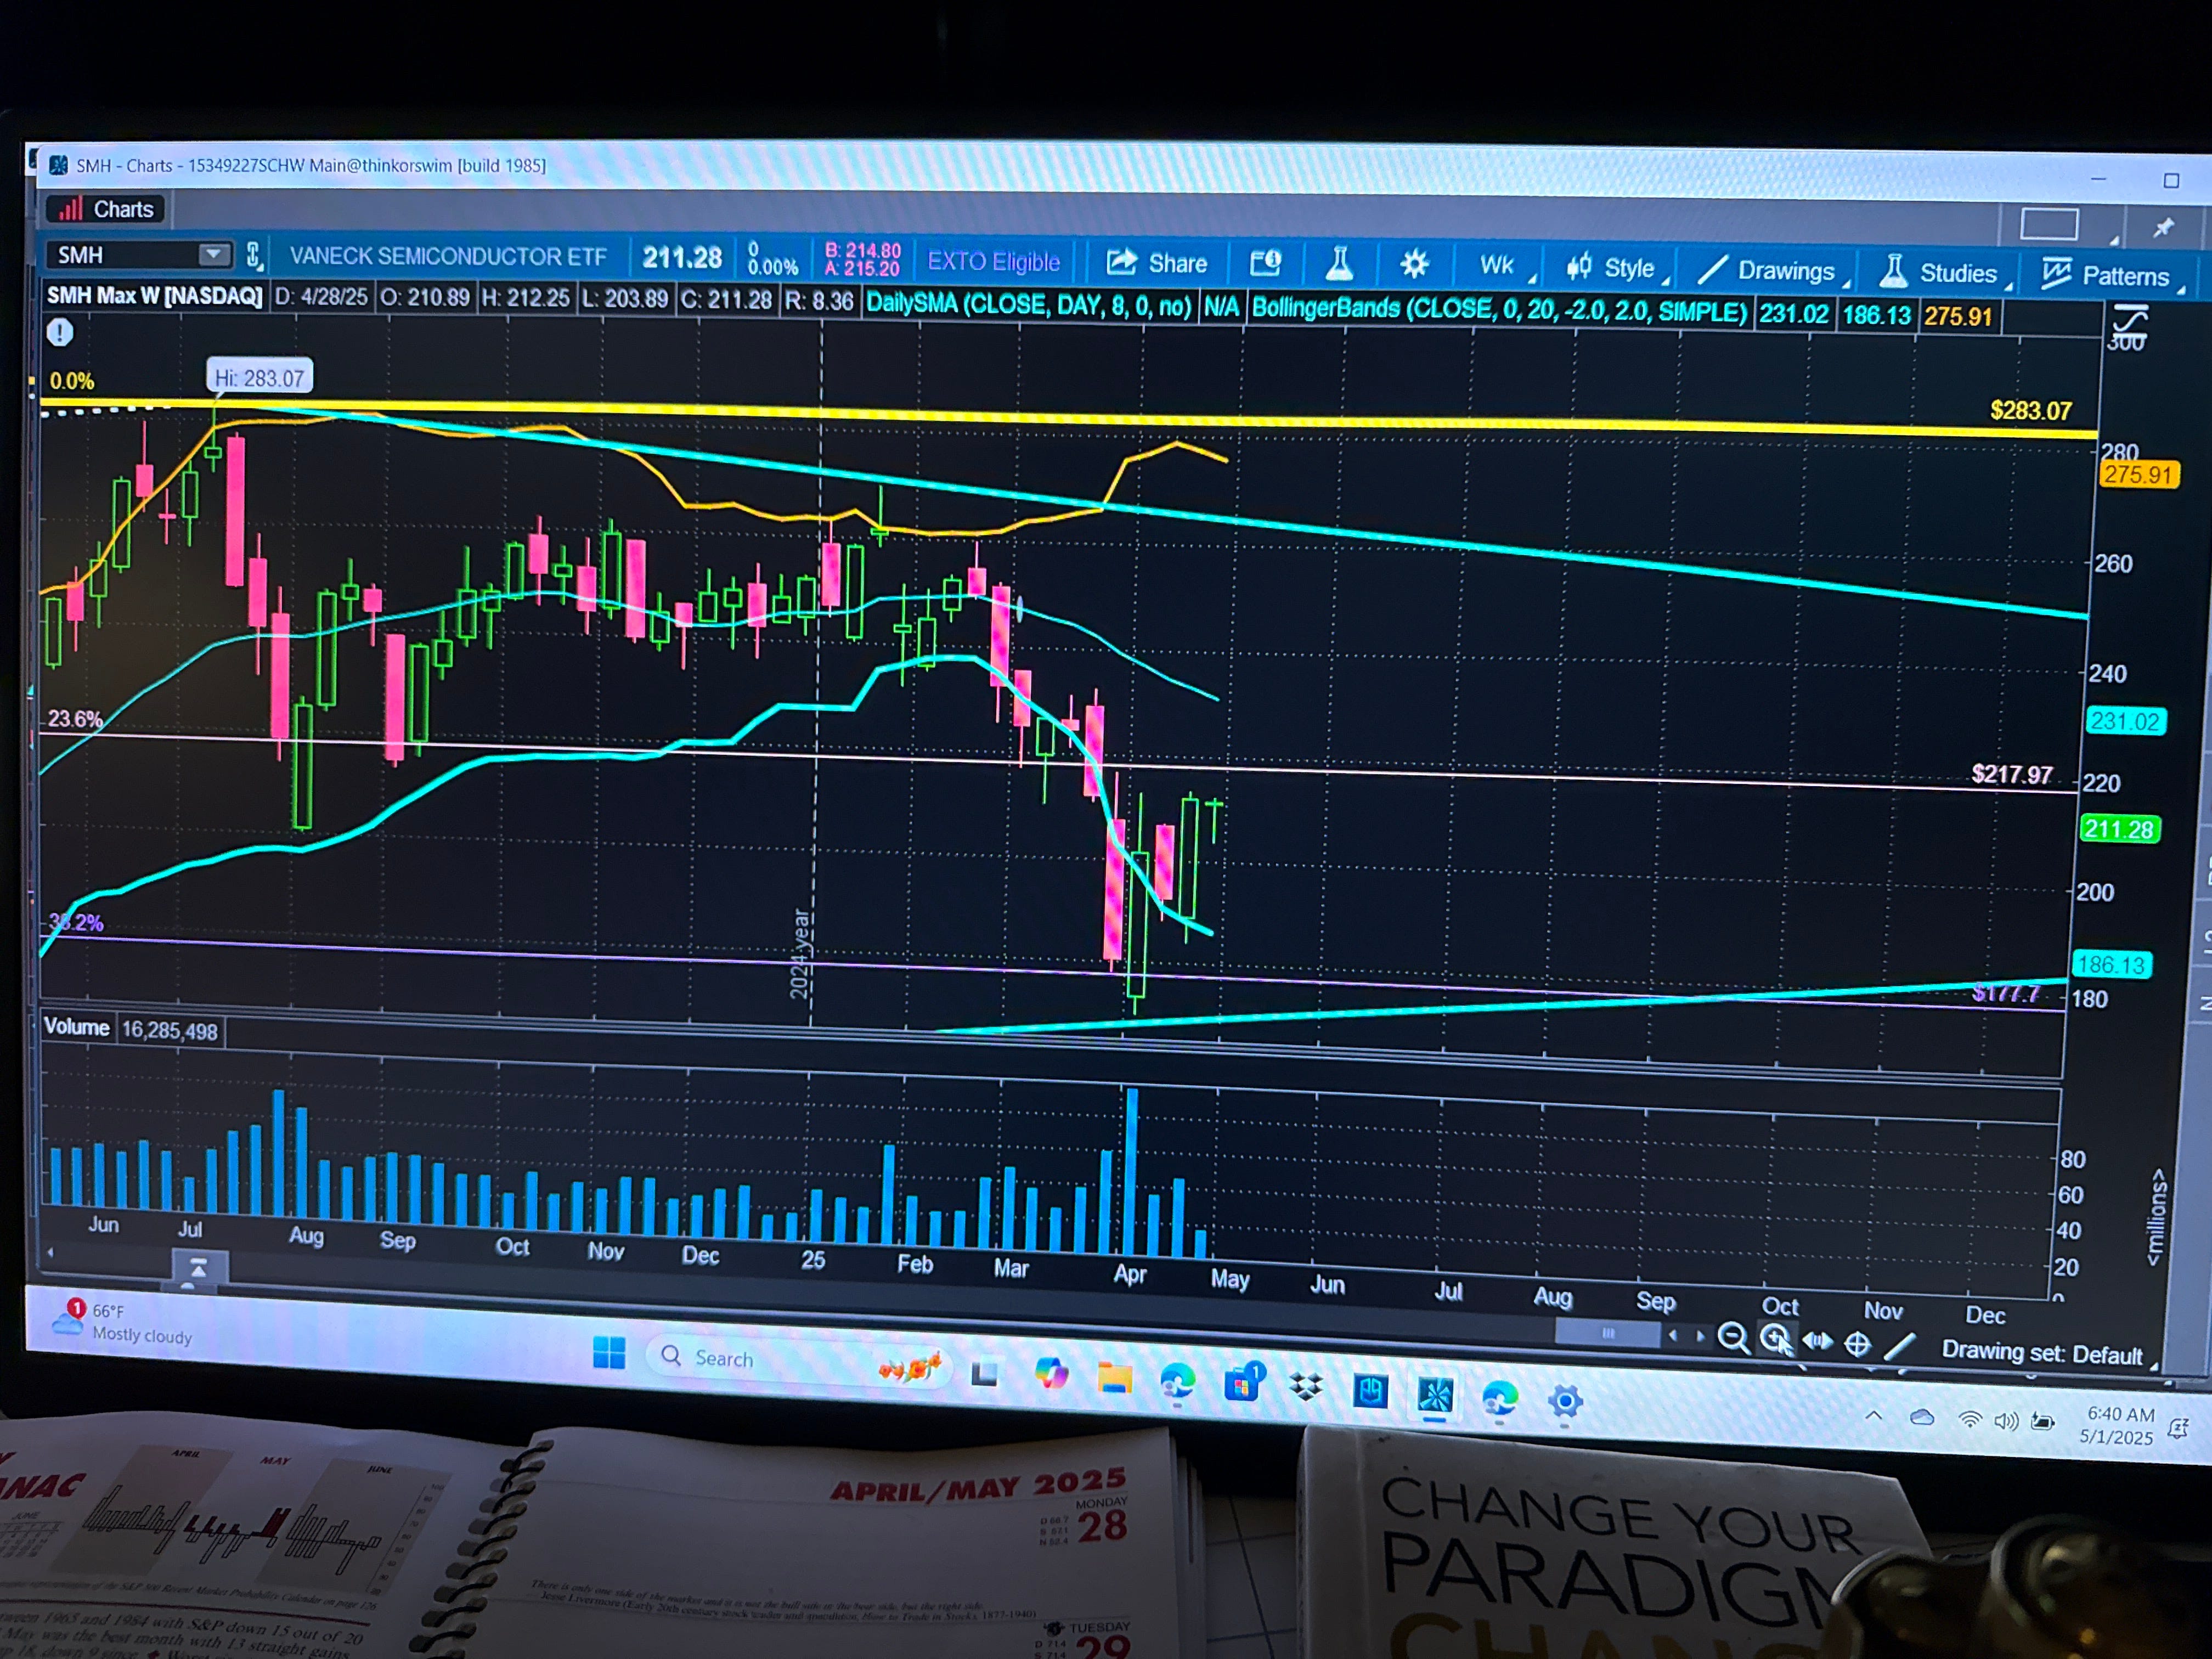
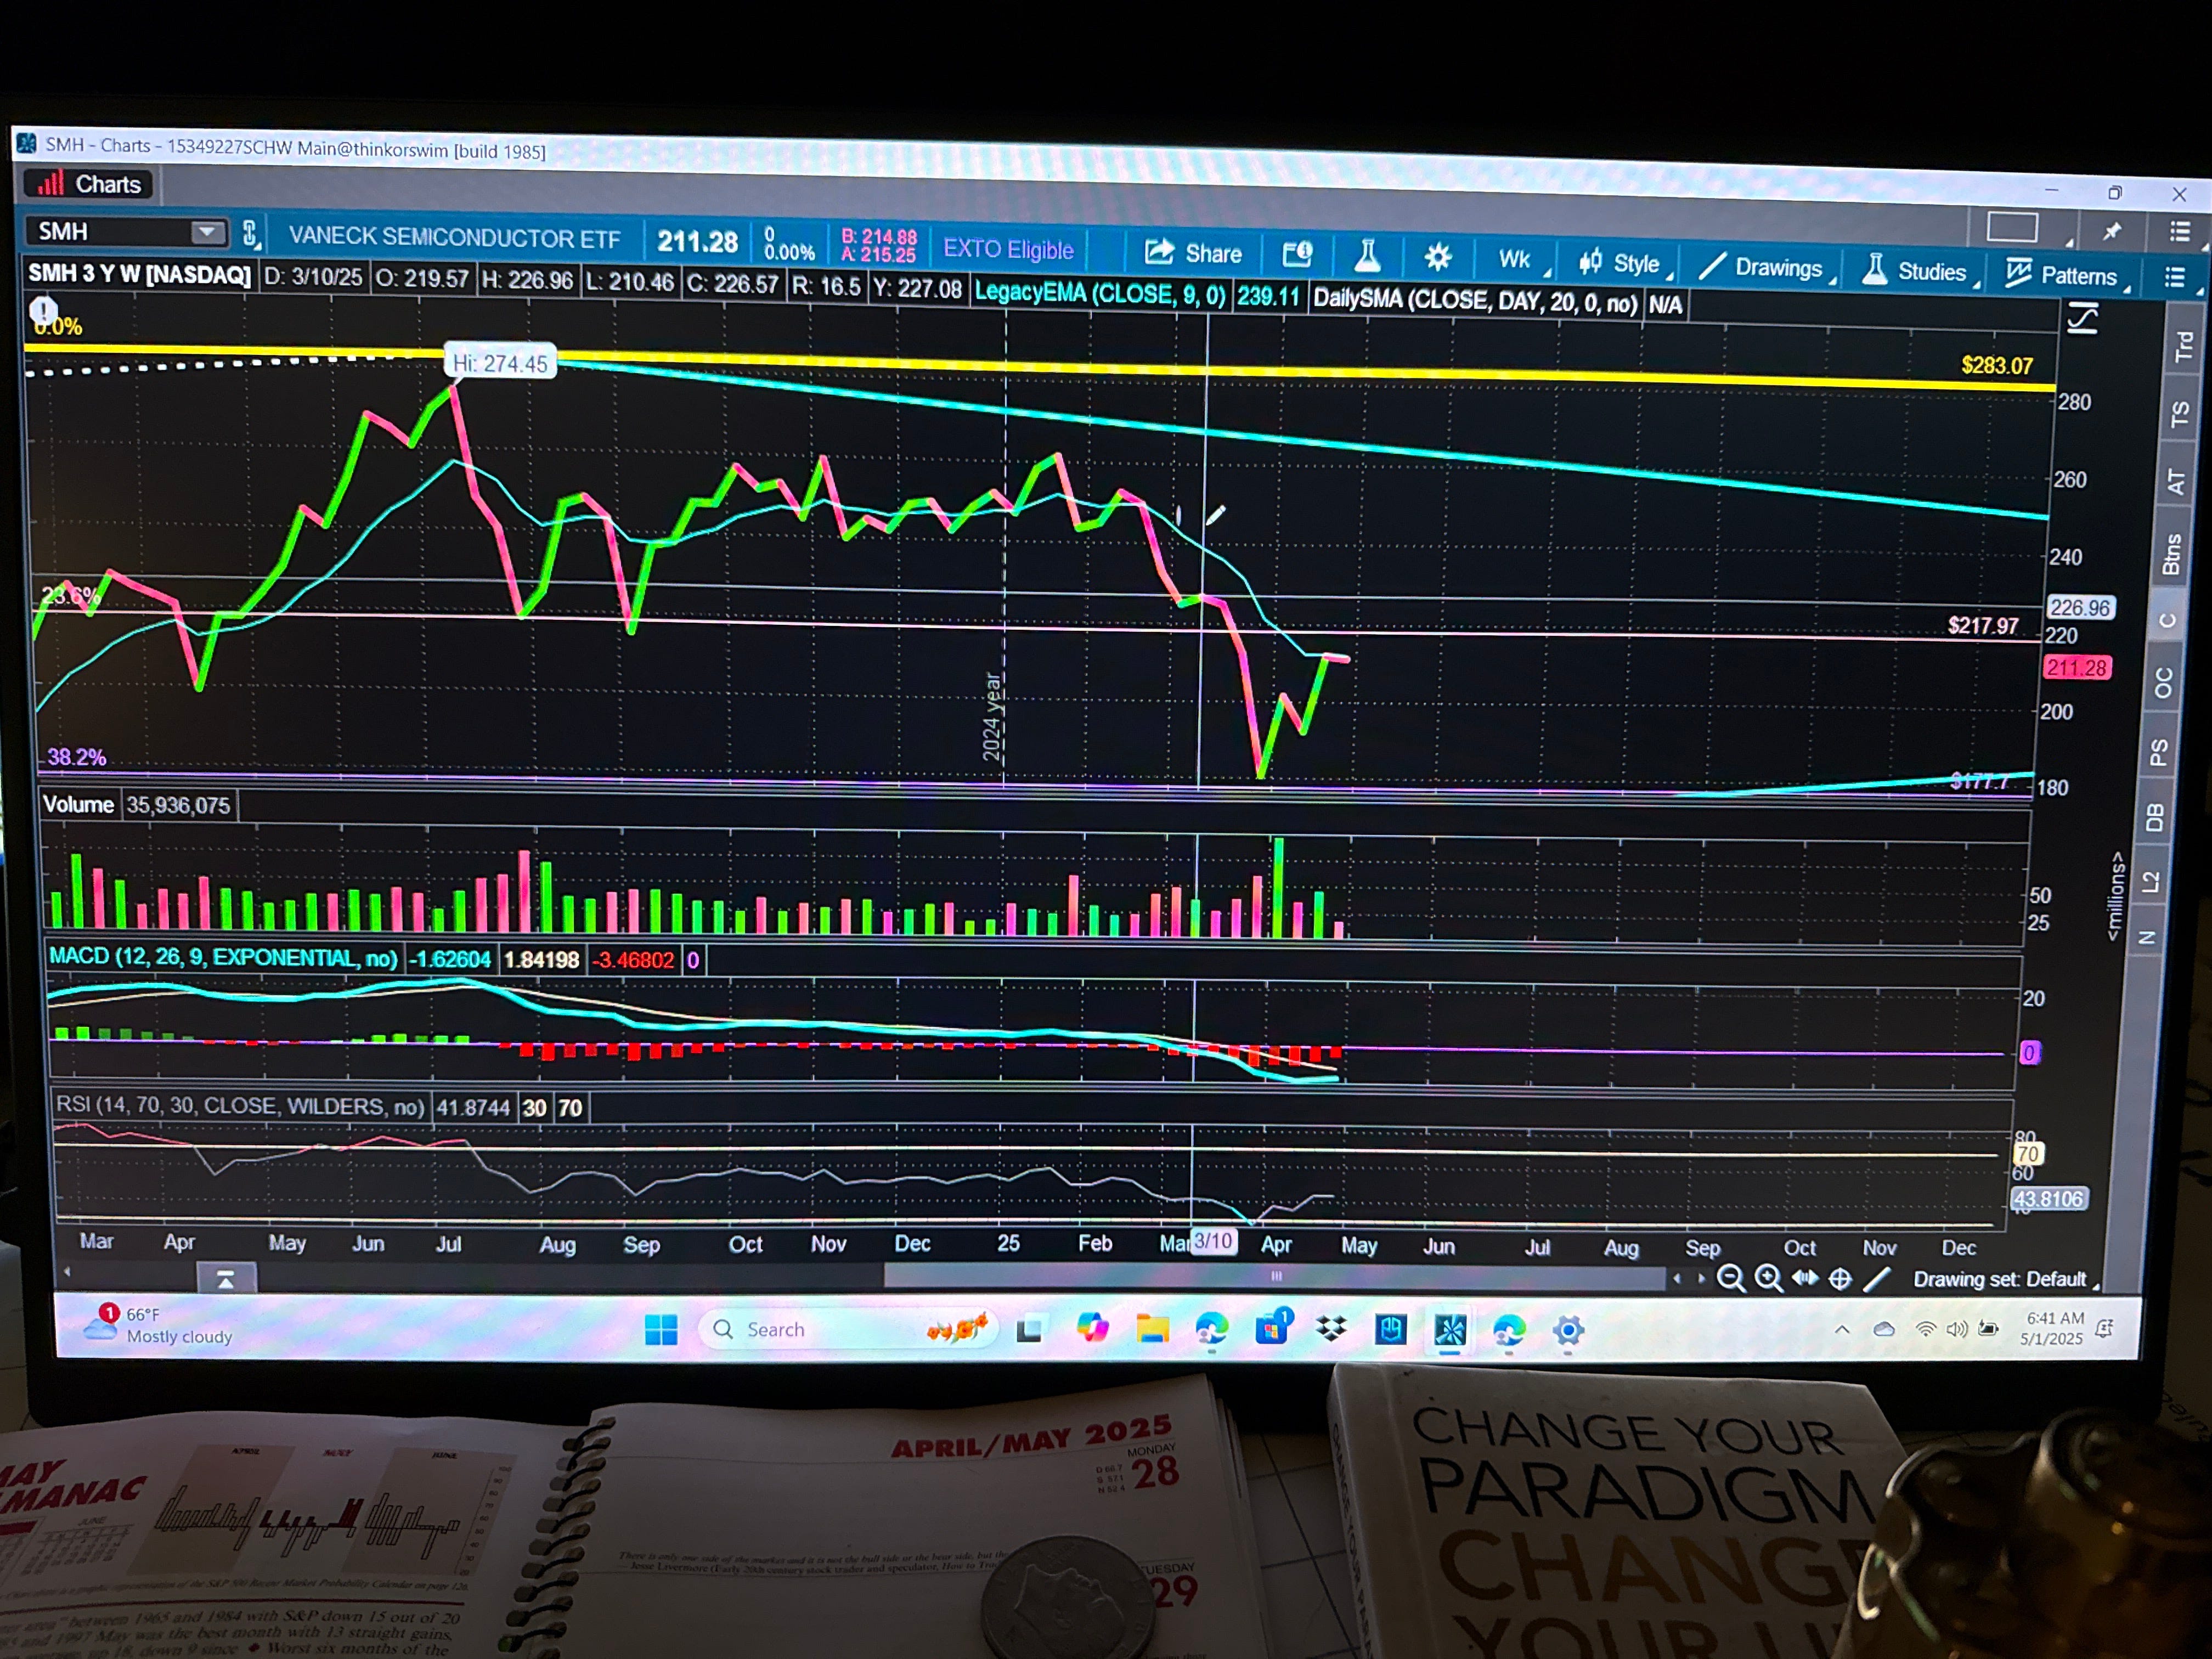
Weekly
Has 9ema $212.06 under the 30ema $227.74 bearish trend check
Momo is gearing to rise into positive territory that $230 ish area has want money back support to soak up on rallies trying to pull back over to uptrend chart layouts
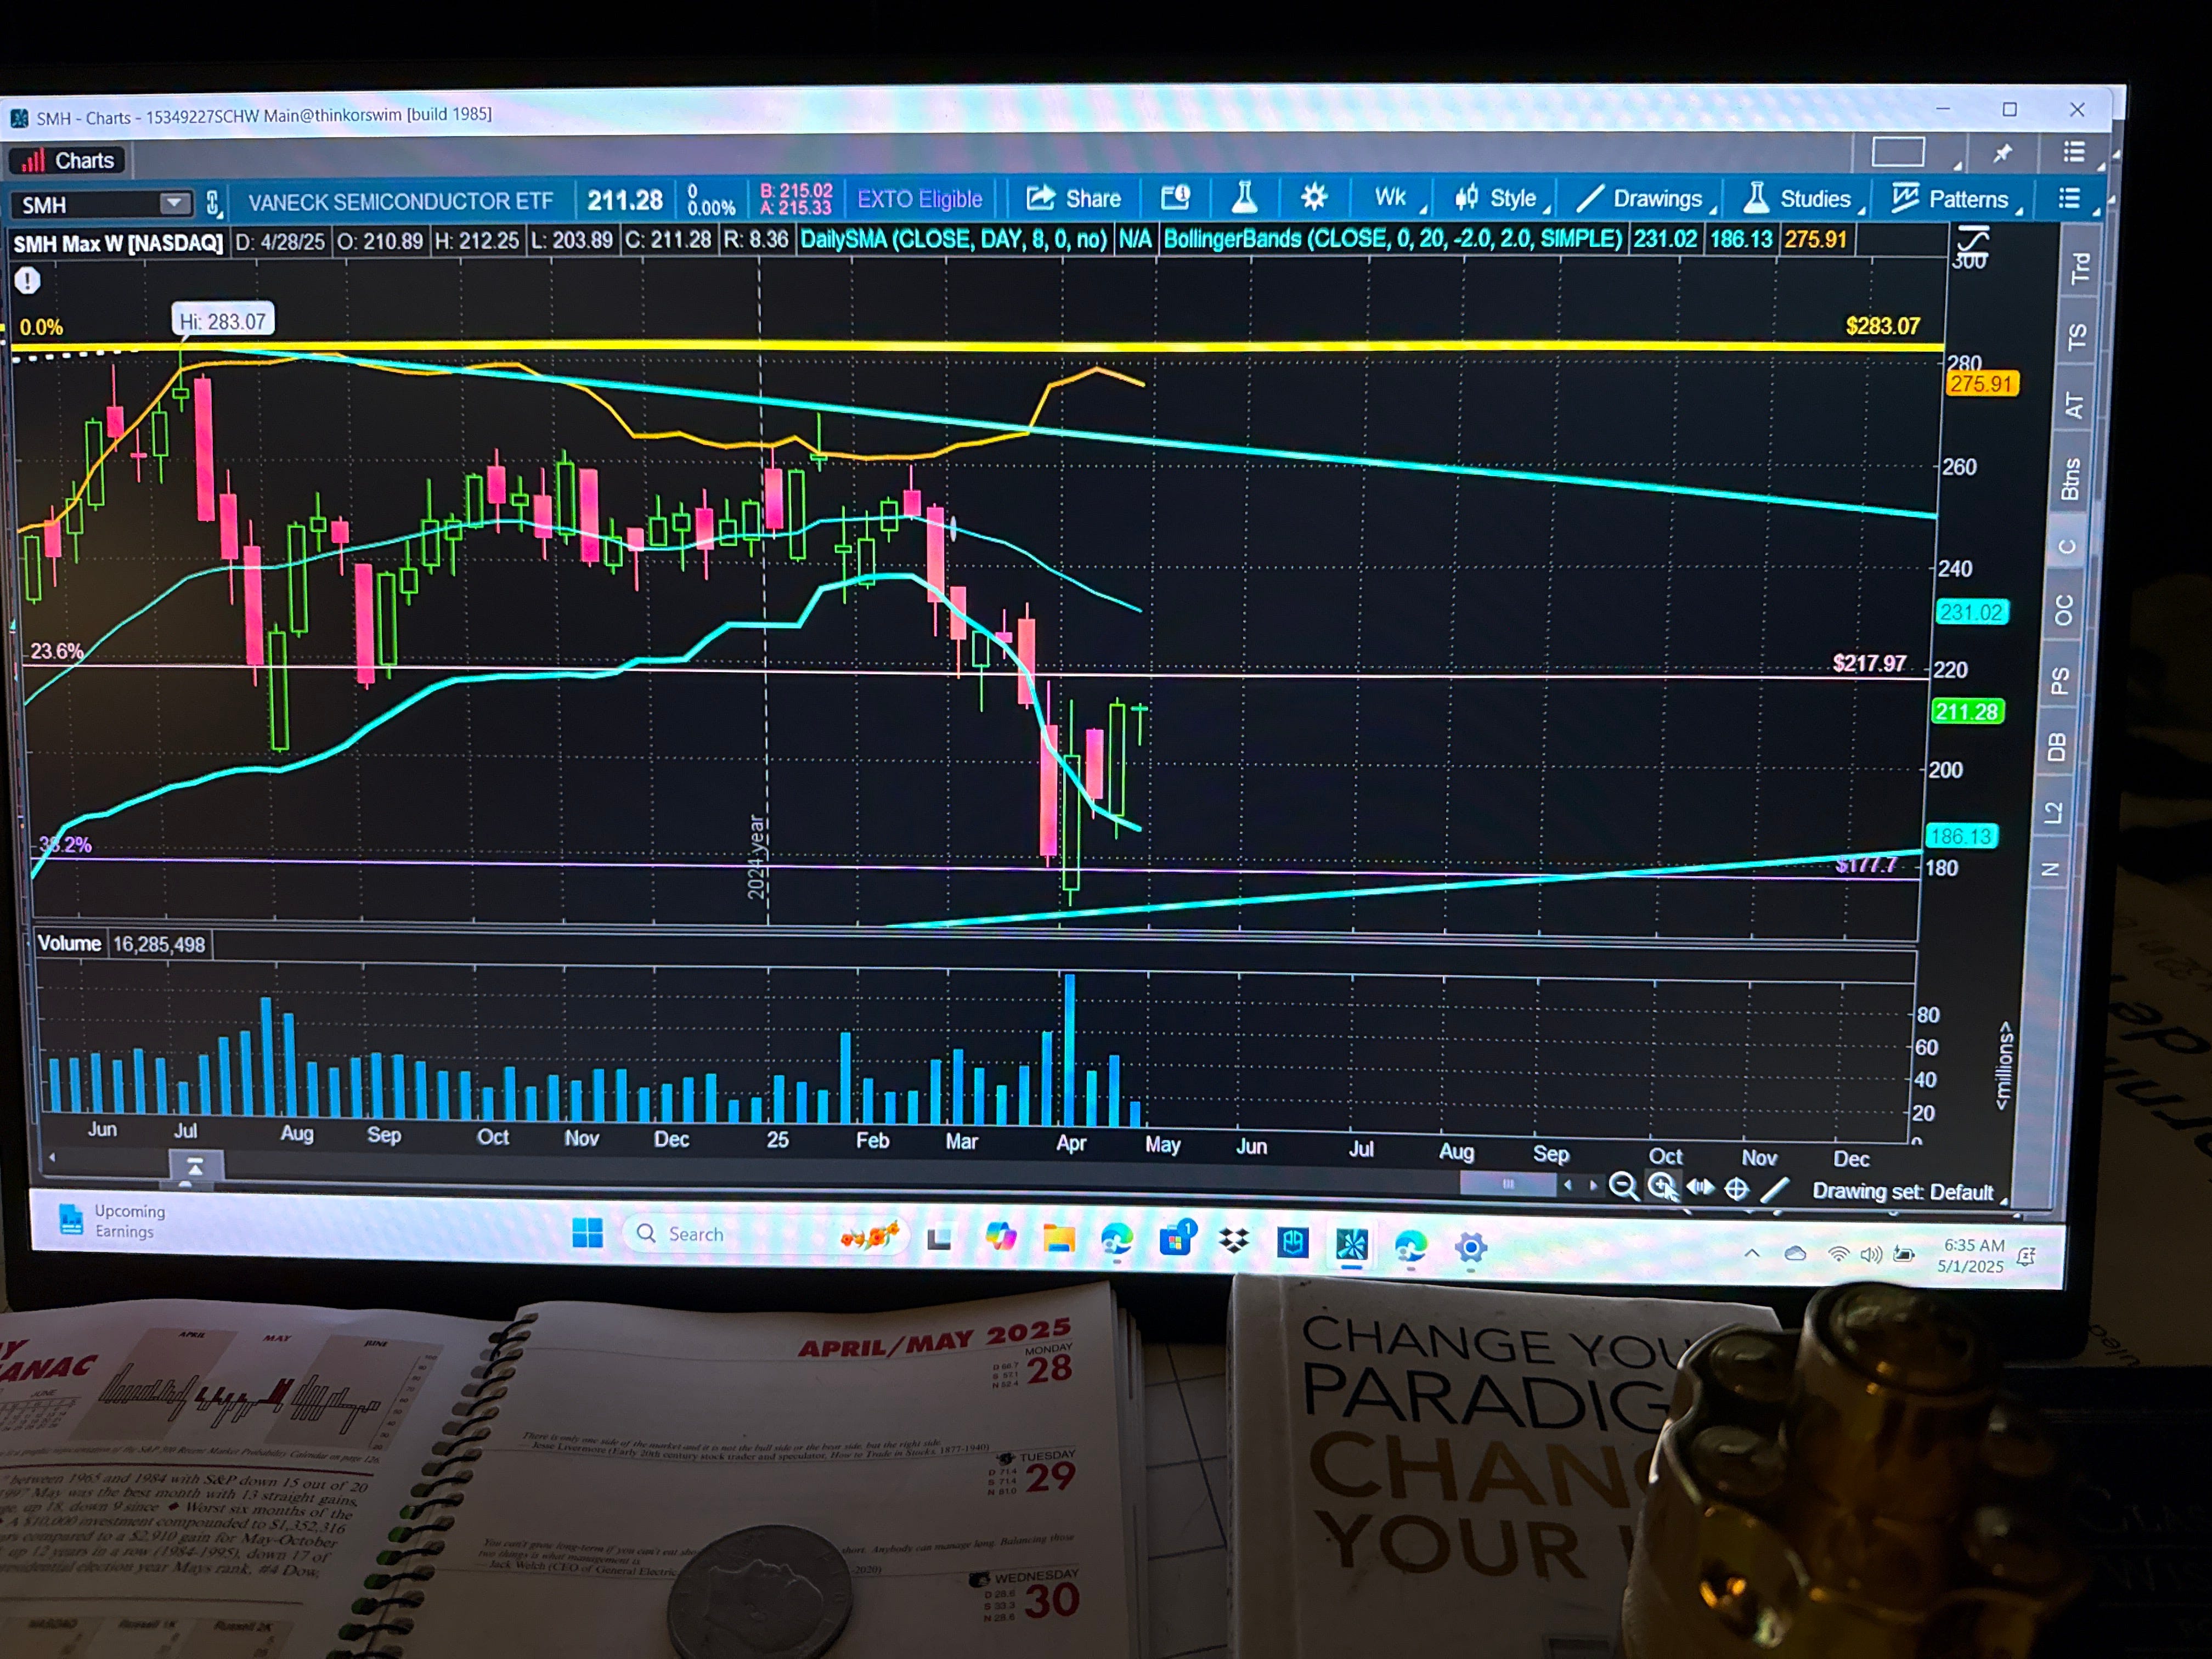
That middle deviation $231.02 looks like a test to get back above and start trending above or if we don’t stick kisser up there a build above we going for new highs but if get sold off immediately not even sticking we will need more time back and filling lower to build enough strength to topple the downside worries in the markets now
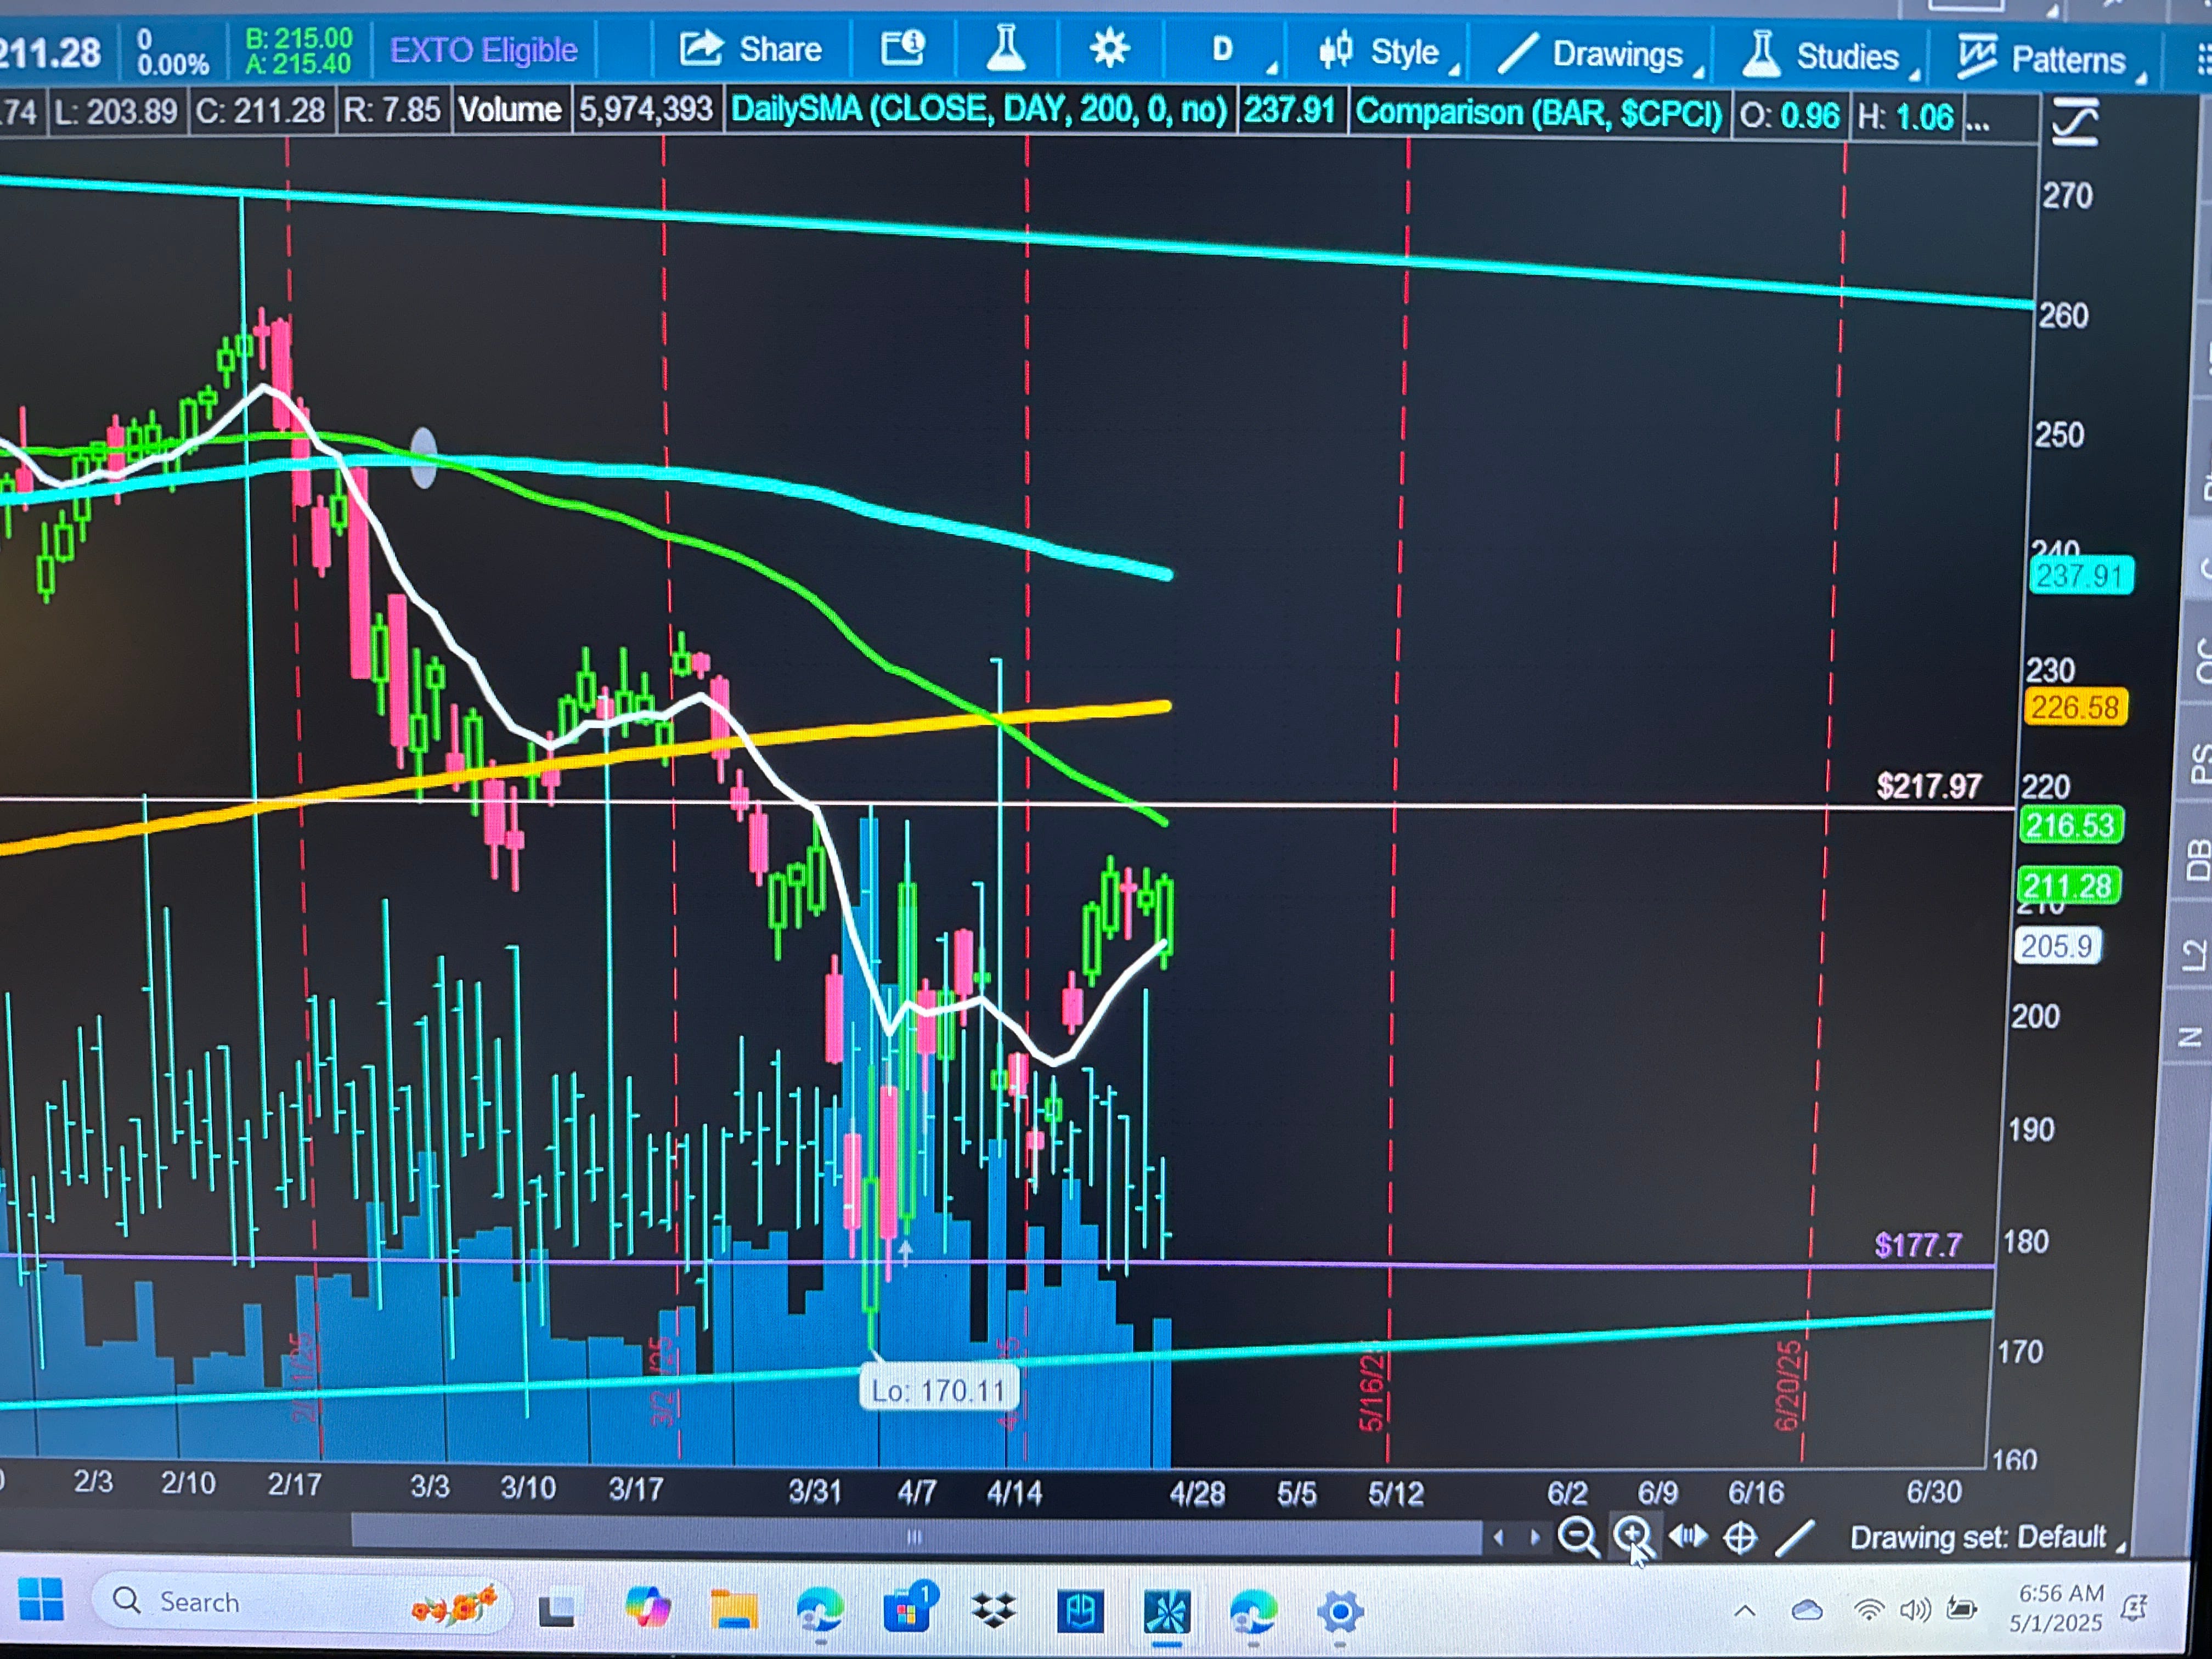
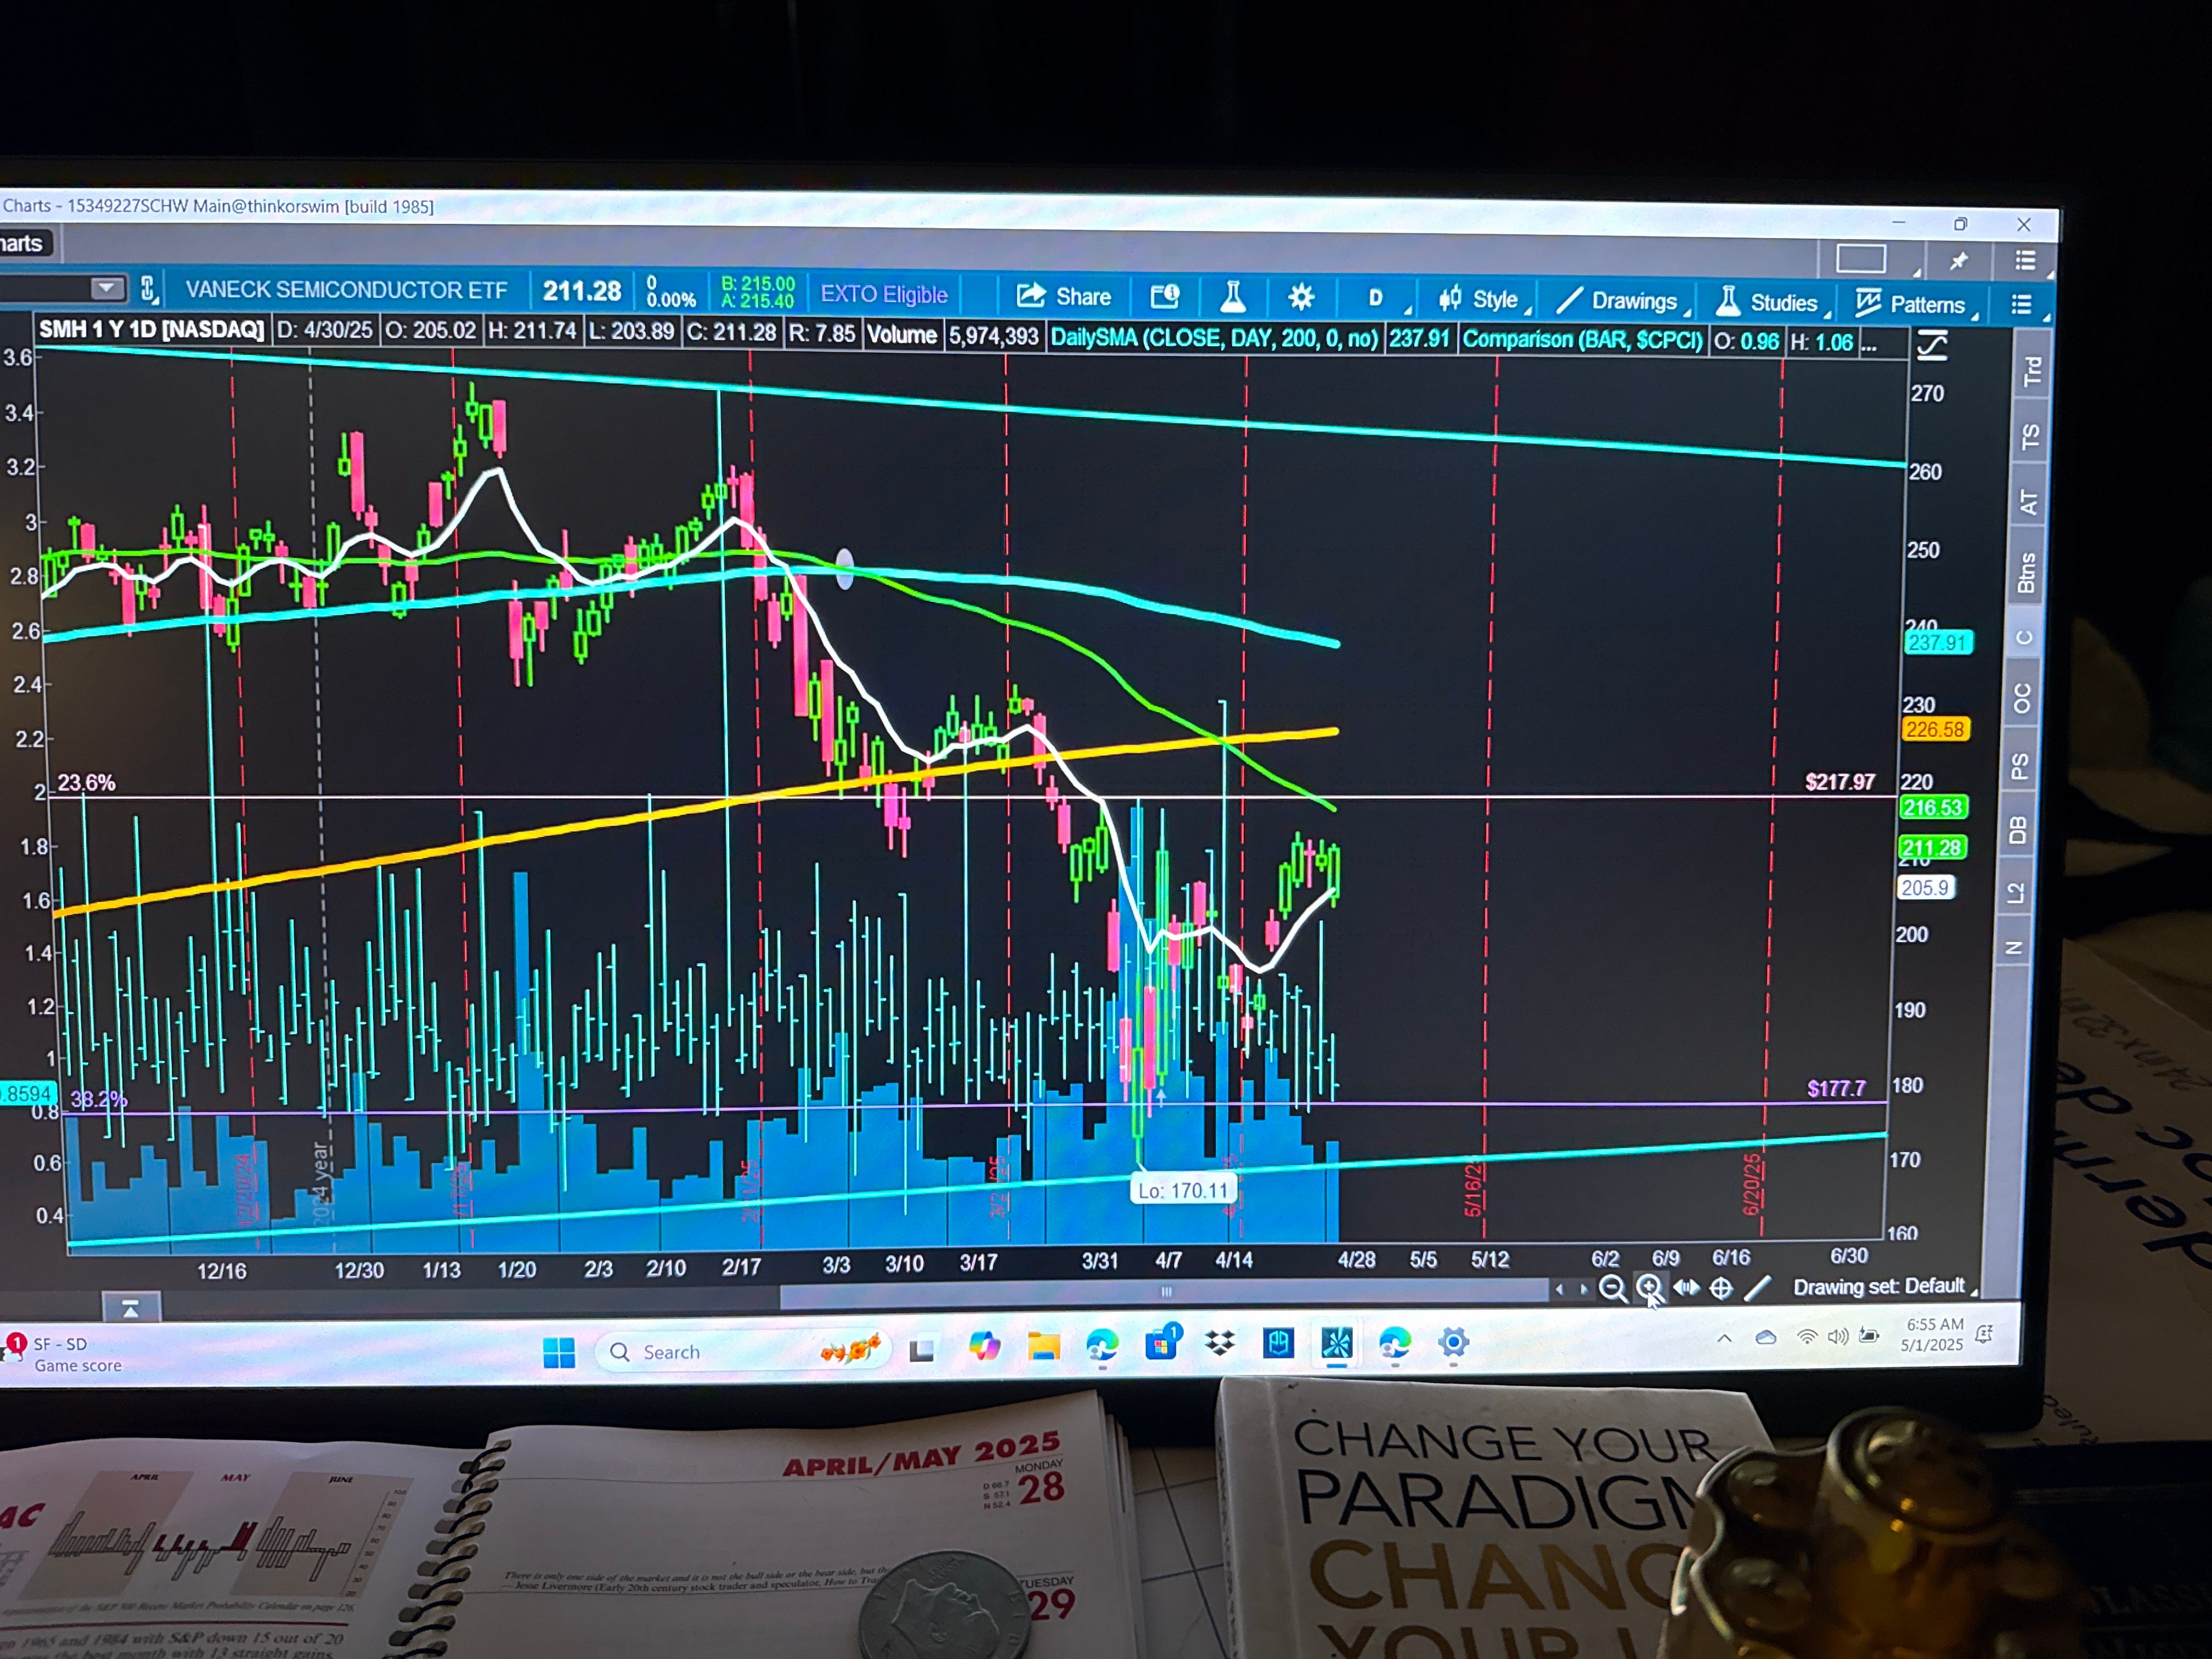
Daily
Has 9sma $202.70 9ema $205.90
20sma $199.34
21 periods upper value $226.58
21 periods lower value $183.91
Currently $215.24 🧐
RSI 53.11
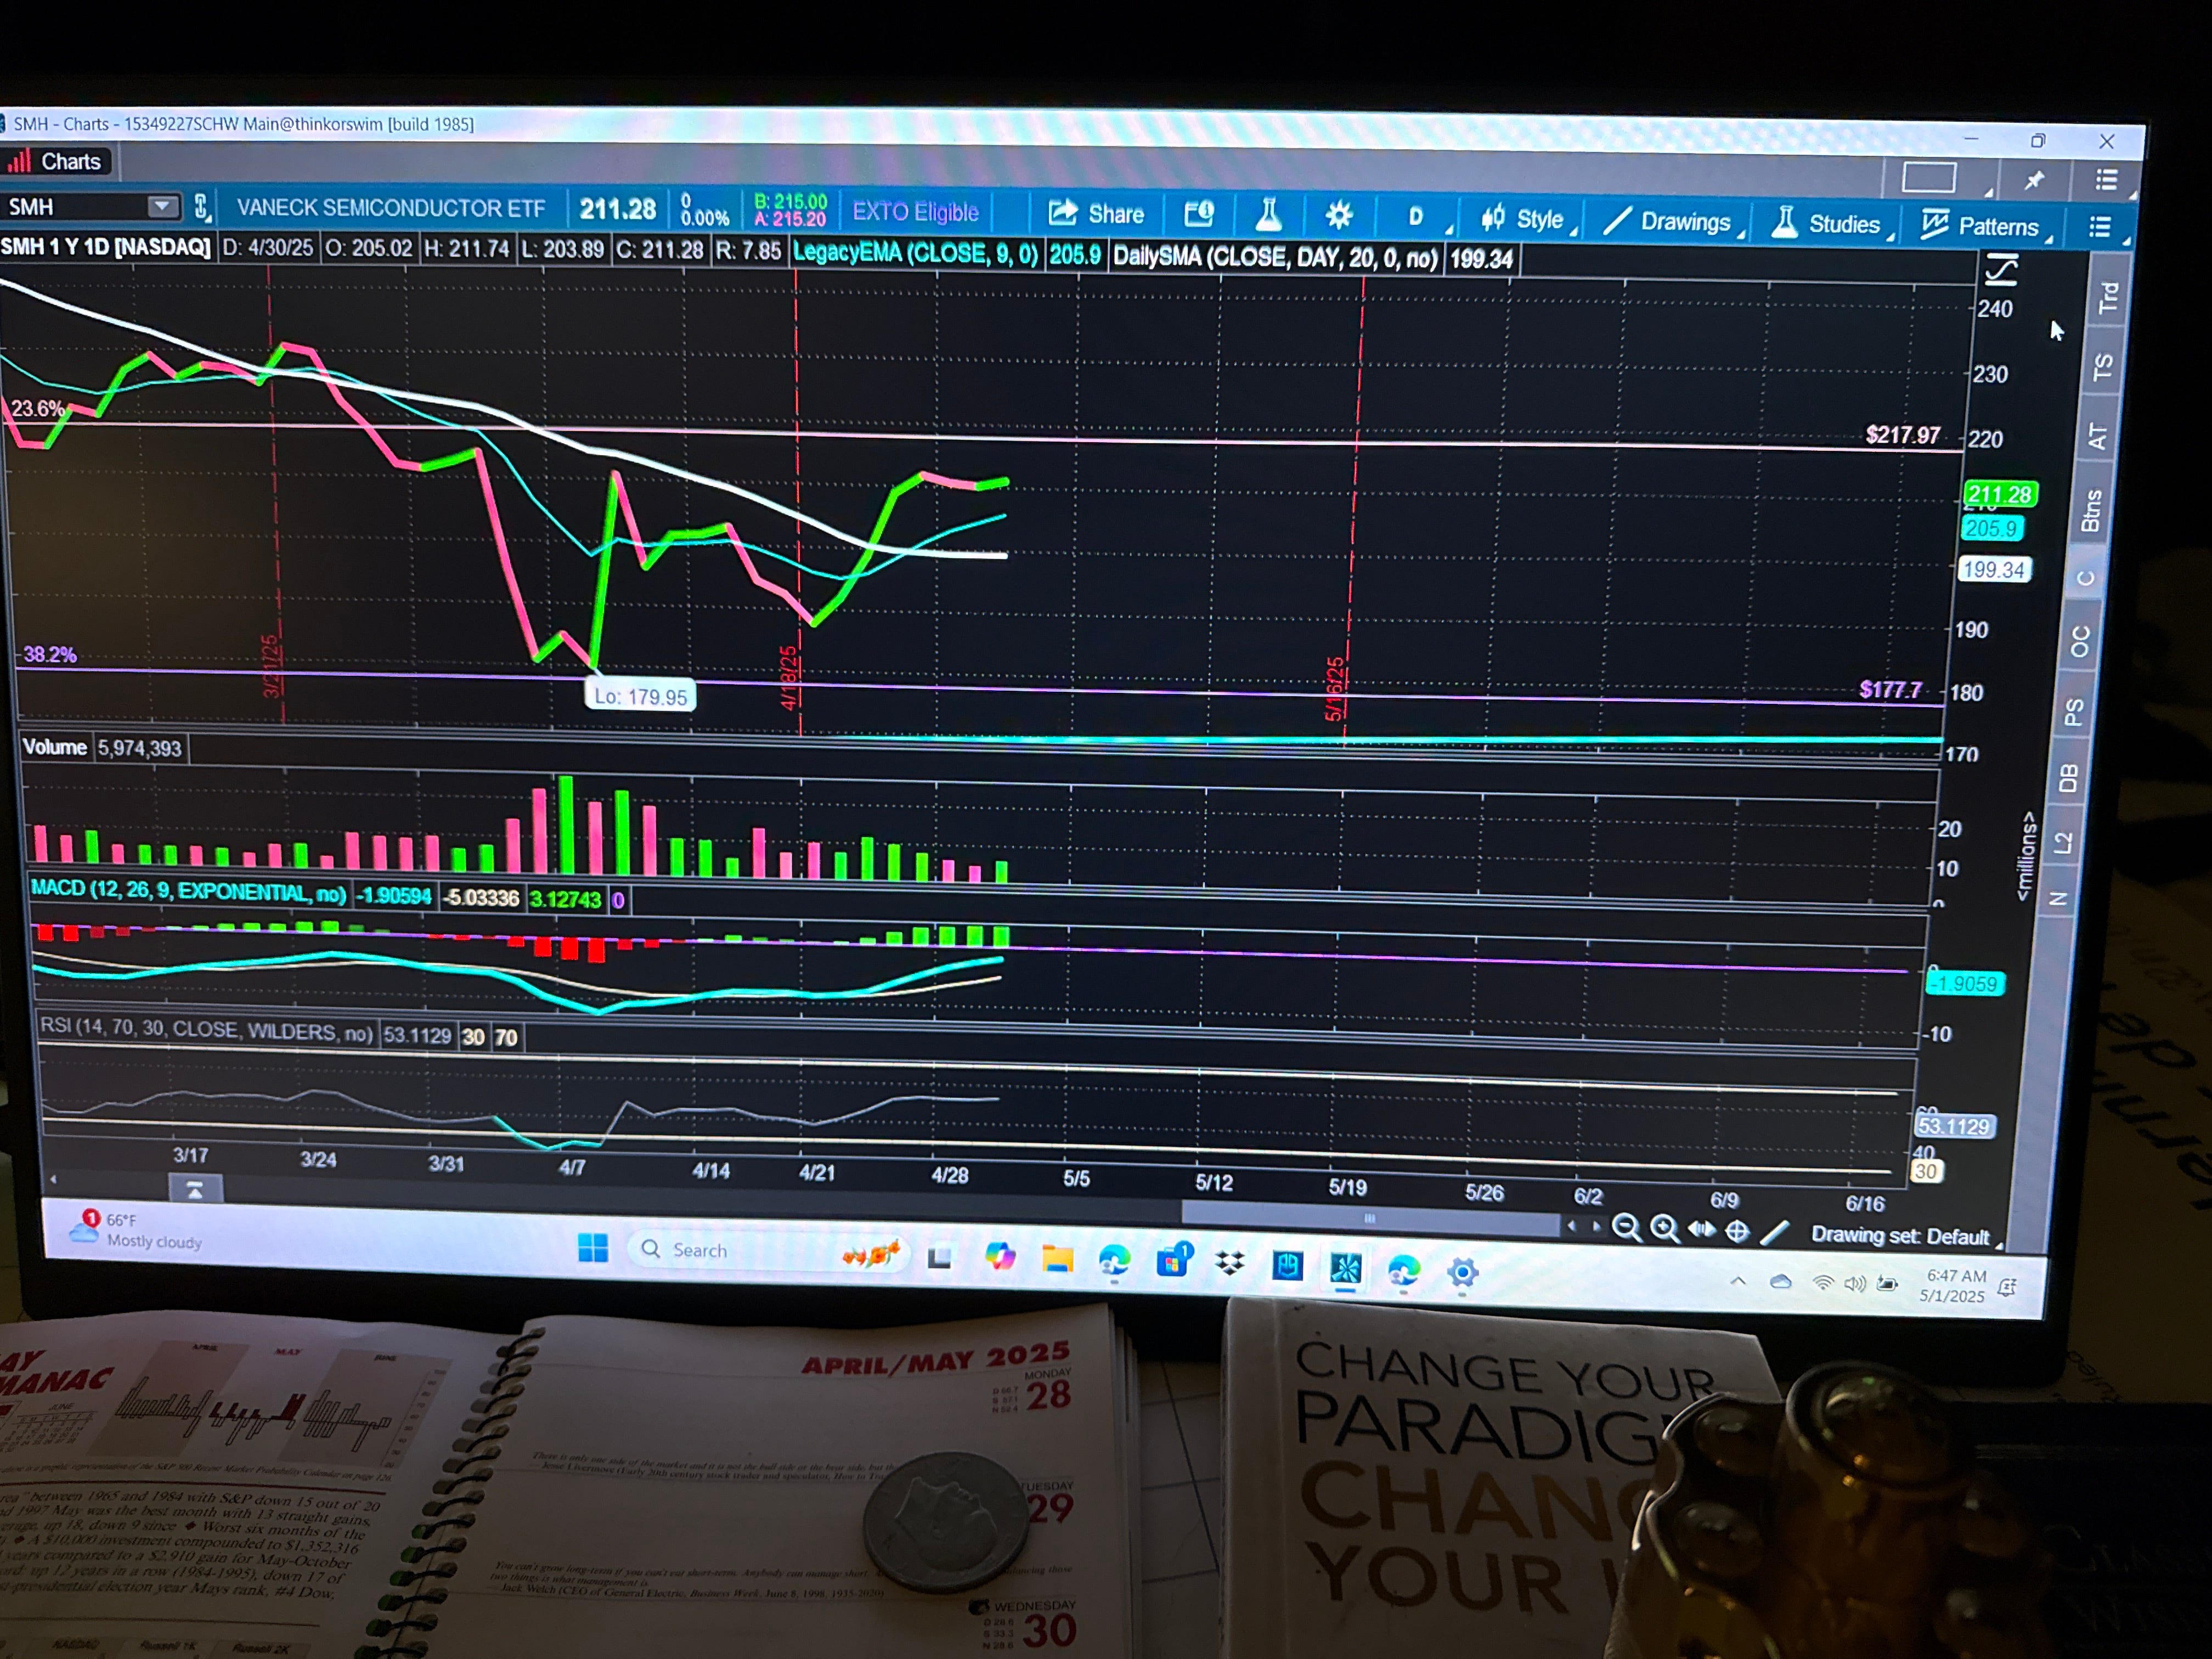
Daily has bull flag on the daily with F flag on weekly is getting a break above high of the bull flag is over $213.29
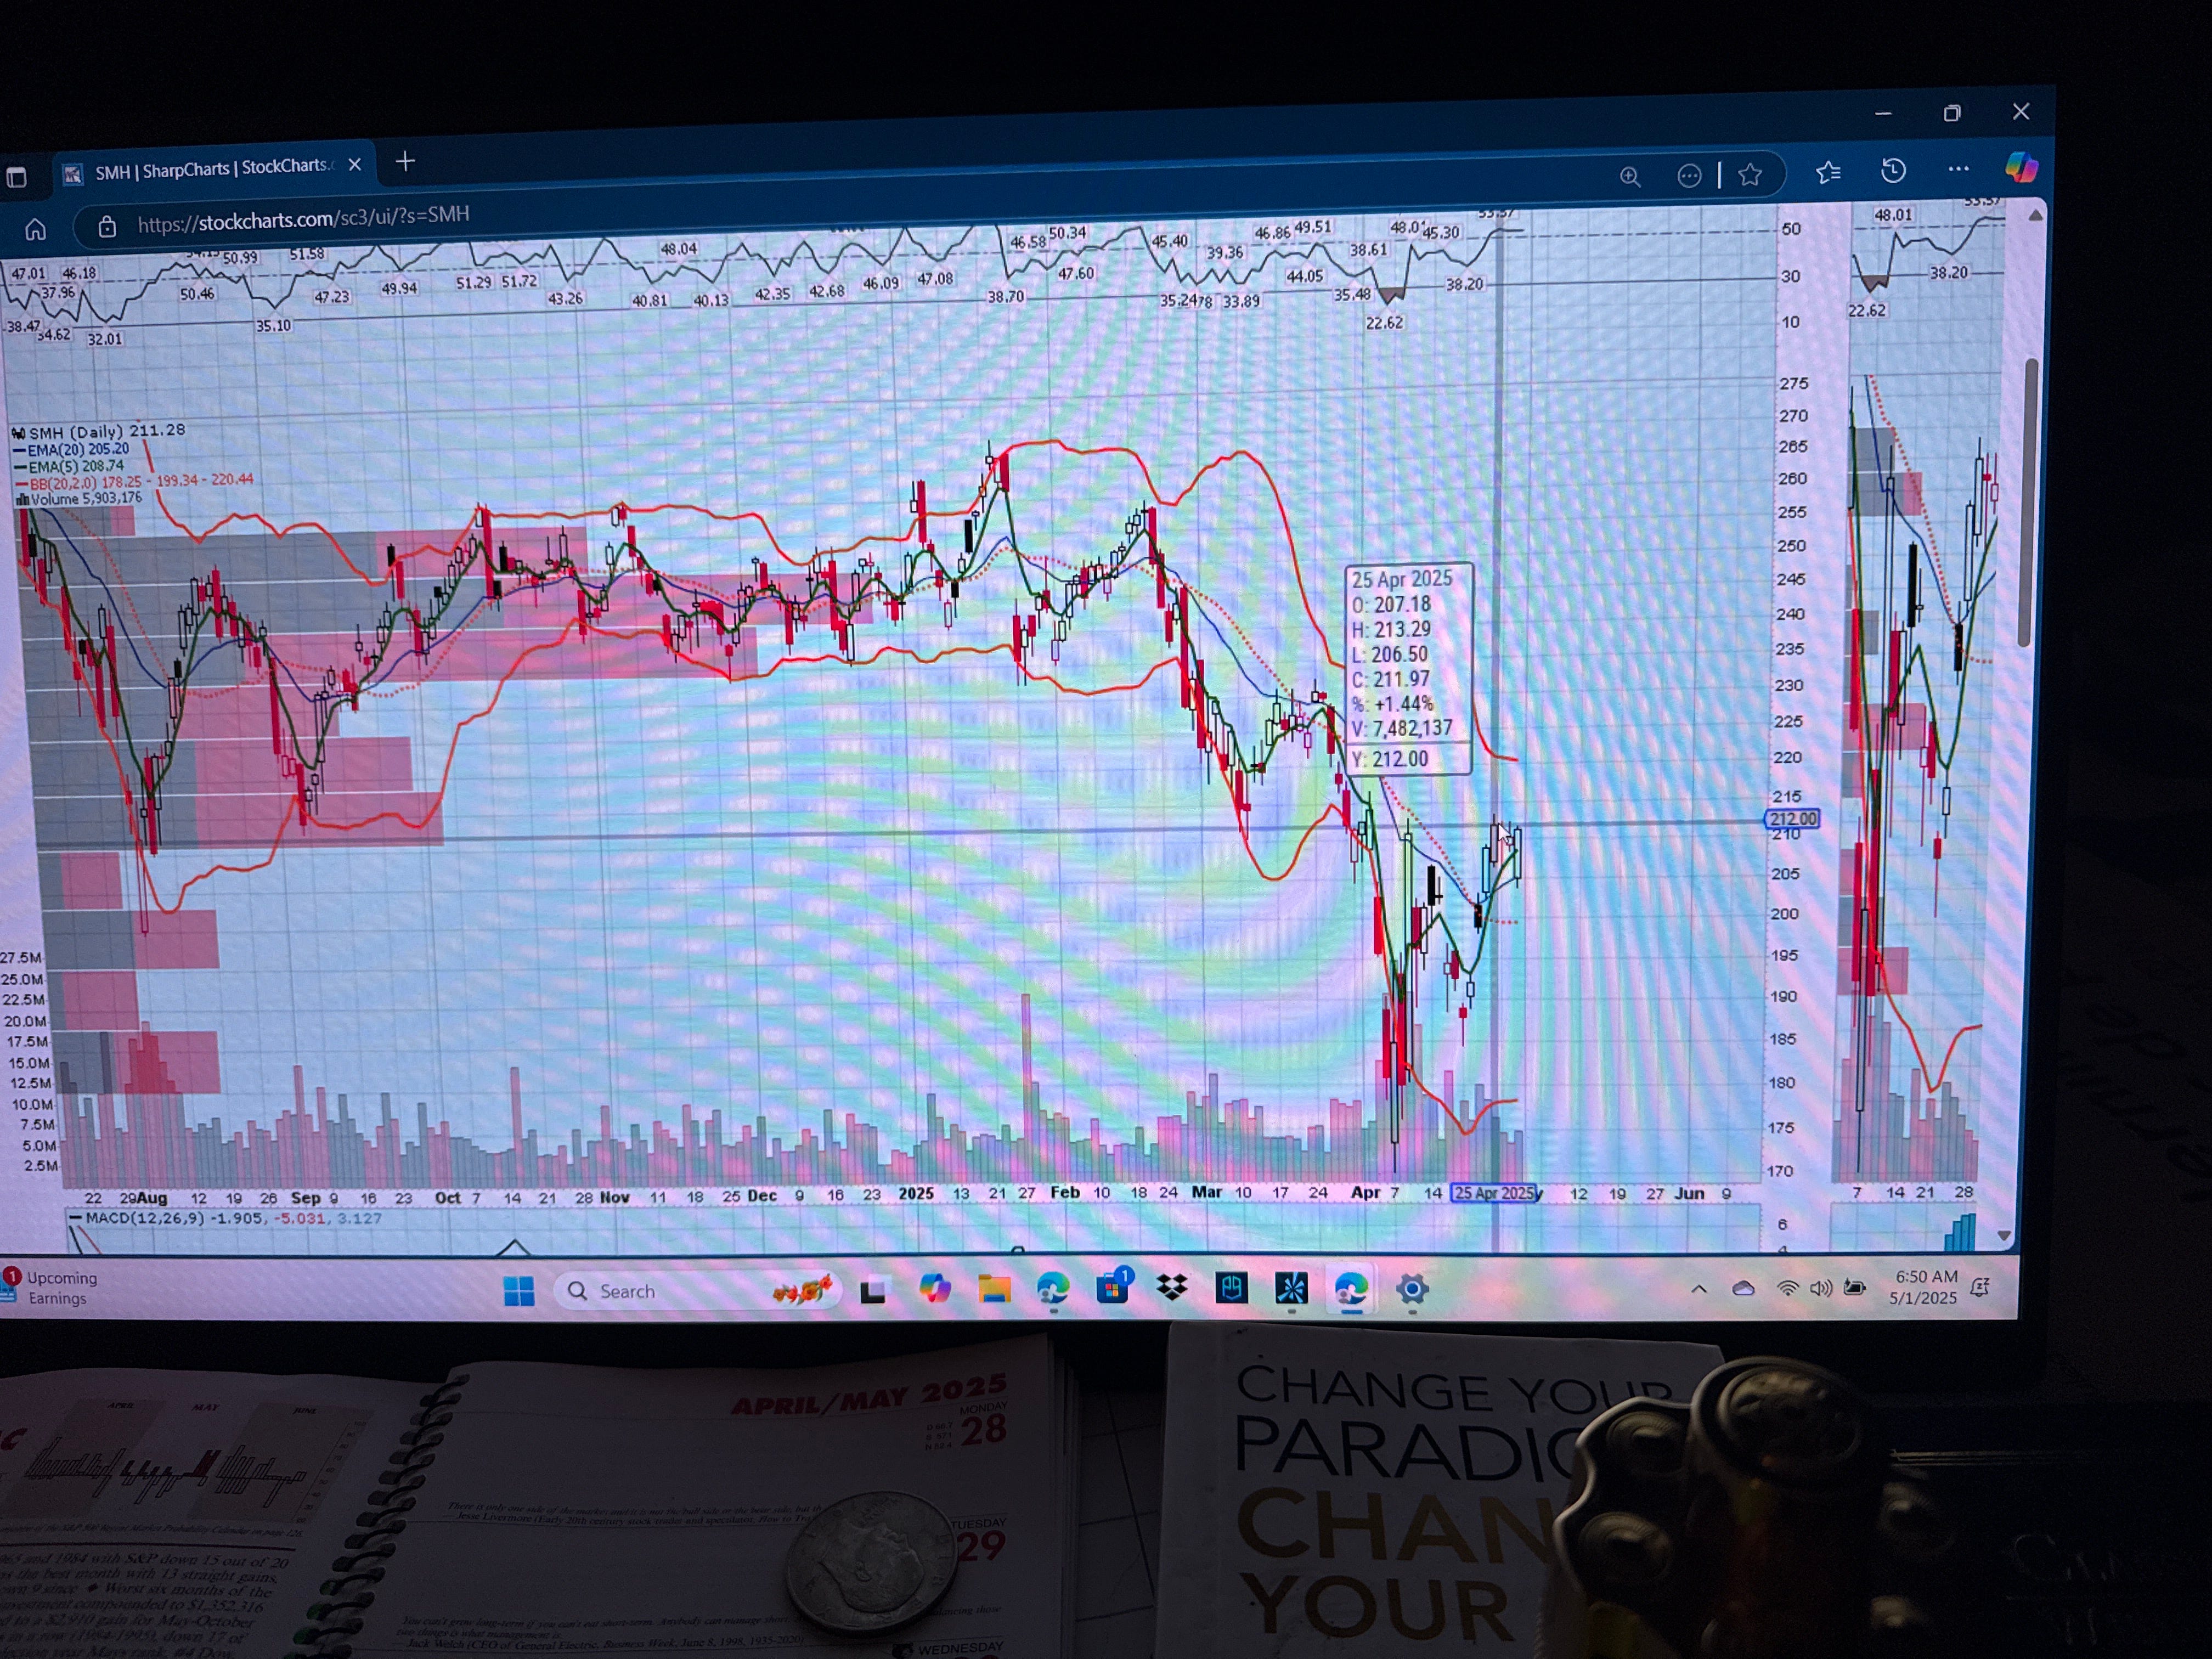
A turn back down under this 23.6% Fibonacci retrace resistance $217.97 places $22O
200sma $237.91